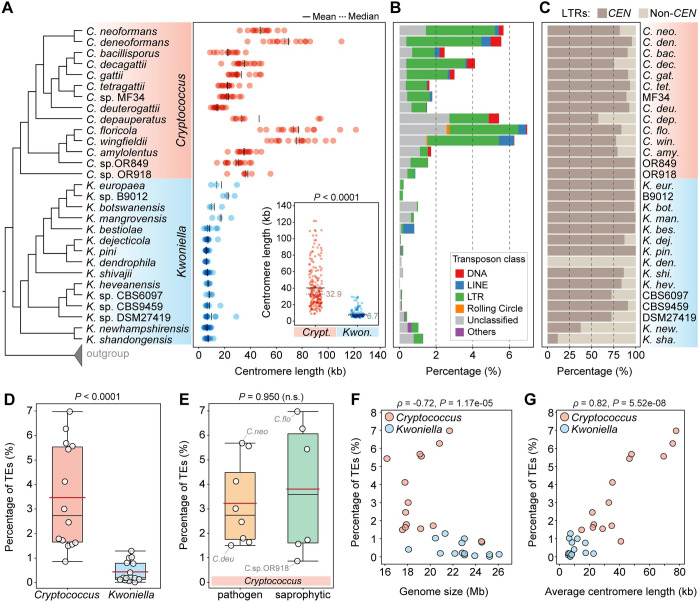
Fig 5. Centromere length and TE content in Cryptococcus and Kwoniella.
(A) Comparison of estimated centromere lengths (in kb) along the phylogeny of Cryptococcus and Kwoniella species. Each dot represents a single centromere, and solid and dashed black lines represent mean and median lengths, respectively. A comparison between the 2 genera is summarized in the inset, showing significantly smaller centromeres in Kwoniella compared to the Cryptococcus lineage (P value obtained by Mann–Whitney U Test). (B) Estimated TE content within each genome. (C) Relative percentage of LTR retrotransposons found in centromeric (CEN) versus non-centromeric (non-CEN) regions (normalized by the total percentage of LTRs). (D, E) Box plots comparing TE content between Cryptococcus and Kwoniella, and between pathogenic and nonpathogenic Cryptococcus species (P values obtained by Mann–Whitney U Test; n.s., not significant). The red line, black line, and boxes denote the mean value, median value, and interquartile range, respectively. (F, G) Correlations between TE abundance with genome size (F) and average centromere length (G). Spearman’s correlation coefficients (ρ) indicate the strength and direction of these relationships. The data underlying this Figure can be found in S6 Appendix and at https://doi.org/10.5281/zenodo.11199354.

