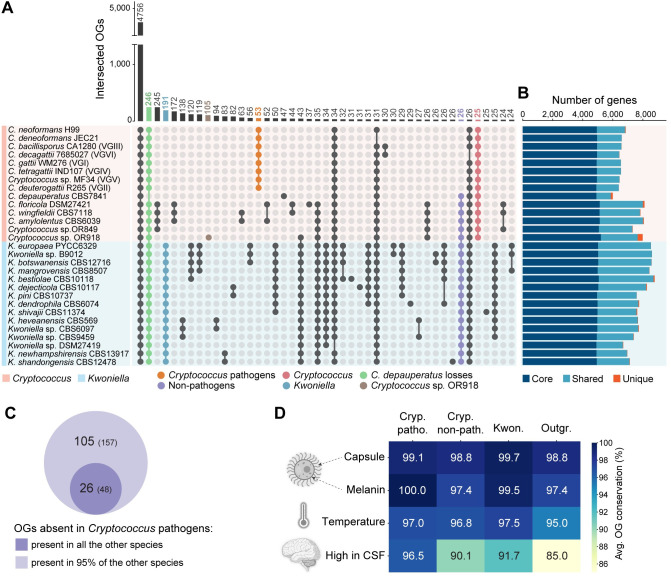
Fig 7. Gene family analysis in Cryptococcus and Kwoniella.
(A) UpSet plot displaying protein family overlaps between Cryptococcus and Kwoniella. The numbers of protein families (OGs) defined by OrthoFinder are indicated for each species intersection, with key intersections emphasized as per the accompanying key. (B) Bar plot categorizing orthology classes into core genes (found in all genomes; dark blue), shared genes (present in multiple but not all genomes; light blue), and unique genes (present within species-specific OGs; dark orange). (C) Venn diagram comparing OGs absent in all pathogenic Cryptococcus species but present in all or 95% of nonpathogenic Cryptococcus and Kwoniella species. (D) Heatmap depicting the average conservation rate in Cryptococcus pathogens, nonpathogenic Cryptococcus, Kwoniella, and outgroup species, of OGs identified in C. neoformans known to be involved in capsule and melanin production, growth at 37°C, and high expression in human cerebrospinal fluid (CSF). Created using clipart from BioRender (https://www.biorender.com/) with permission. The data underlying this Figure can be found in S4 and S5 Appendices and at https://doi.org/10.5281/zenodo.11199354.

