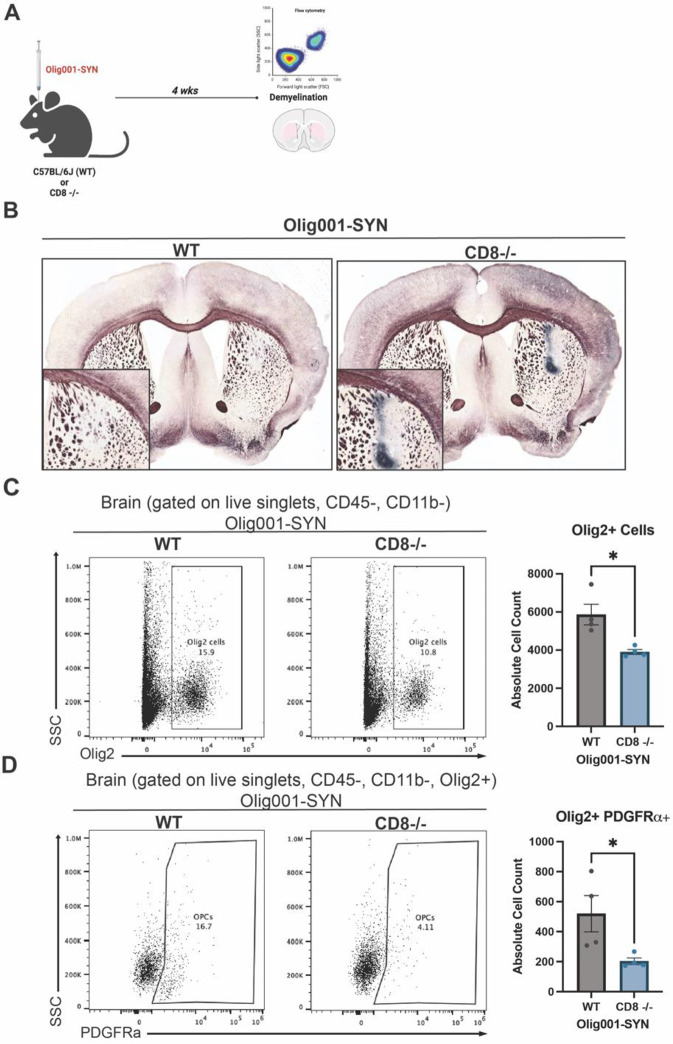
Figure 3: CD8 knockout enhanced demyelination in the Olig001-SYN mouse model.
(A) WT and CD8 knockout mice at 8–12 weeks were injected with Olig001-SYN, and after four weeks tissue was collected. For flow cytometry experiments, n=4 or 5 were used for each group. For Black-Gold stains, n=5 for each group. (B) Representative Black-Gold images of WT and CD8 knockout tissue with GCI pathology. Higher magnification inserts with a magnification of 20x of areas of demyelination are located at the bottom left of their corresponding images. (C) Flow cytometry dot plots of Olig2+ cells in WT and CD8−/− mice injected with Olig001-SYN. Quantification of flow cytometry is to the right of dot plot. Mean values +/− SEM are plotted, non-parametric Wilcoxon test, *p < 0.05. (D) Flow cytometry dot plots and quantification to the right of OPCs (gated on singlets, live cells, CD11b−, CD45−, Olig2+, PDGFRa+). Mean values +/− SEM are plotted, non-parametric Wilcoxon test, *p < 0.05. For flow cytometry experiments, n = 4 per group, two mice were pooled for each sample. Both male and female mice were used for all experiments.

