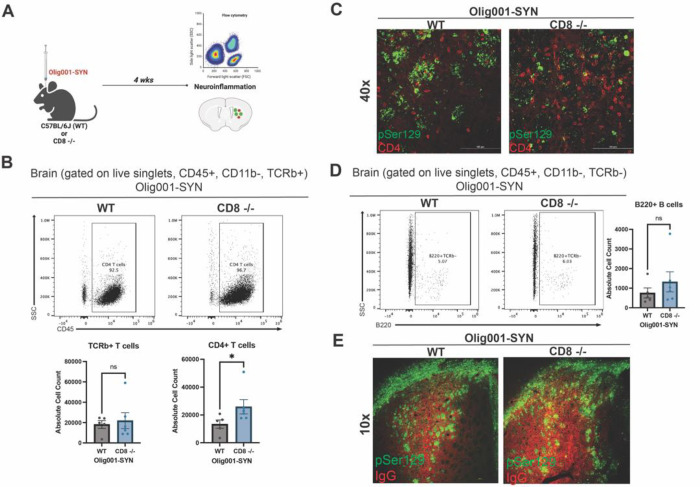
Figure 5: CD8 knockout mice show enhanced infiltration of CD4+ T cells and unchanged B cell infiltration and IgG deposition at four weeks post Olig001-SYN transduction.
(A) Both WT and CD8 knockout mice were injected with Olig001-SYN into the dorsolateral striatum, and tissue was collects four weeks later to assess for neuroinflammation with flow cytometry and immunohistochemistry. (B) Flow cytometry dot plots of CD4+ T cells (gated on singlets, live cells, CD11b−, CD45+, TCRb+ CD4+) in striatum of WT and CD8 knockout mice with α-syn induced neuroinflammation; the quantification is to the right of the dot plots. Mean values +/− SEM are plotted, non-parametric Wilcoxn test, ns= no significance, *p < 0.05. n= 4/5 per group, with two mice pooled per sample. (C) Representative immunohistochemistry images of CD4+ T cells (red) surrounding α-syn (pSer129; green) in WT and CD8 knockout mice with GCI pathology (scale bar = 100 μm, n=3 per group). (D) Flow cytometry dot plots of B cells (gated on singlets, live cells, CD11b−, CD45+, TCRb−, B220+) of WT and CD8 knockout injected with Olig001-SYN, the quantification of the dot plots for B cells is to the right of the dot plots. Mean values +/− SEM are plotted, non-parametric Wilcoxn test, ns= no significance. n= 4/5 per group, with two mice pooled per sample. (E) Representative immunohistochemistry images taken at 10x of IgG deposition (IgG; red) in WT and CD8 knockout mice when α-syn (pSer129; green) is present. Scale bar = 100 μm. n=3 per group. Both female and male mice were used for all experiments.

