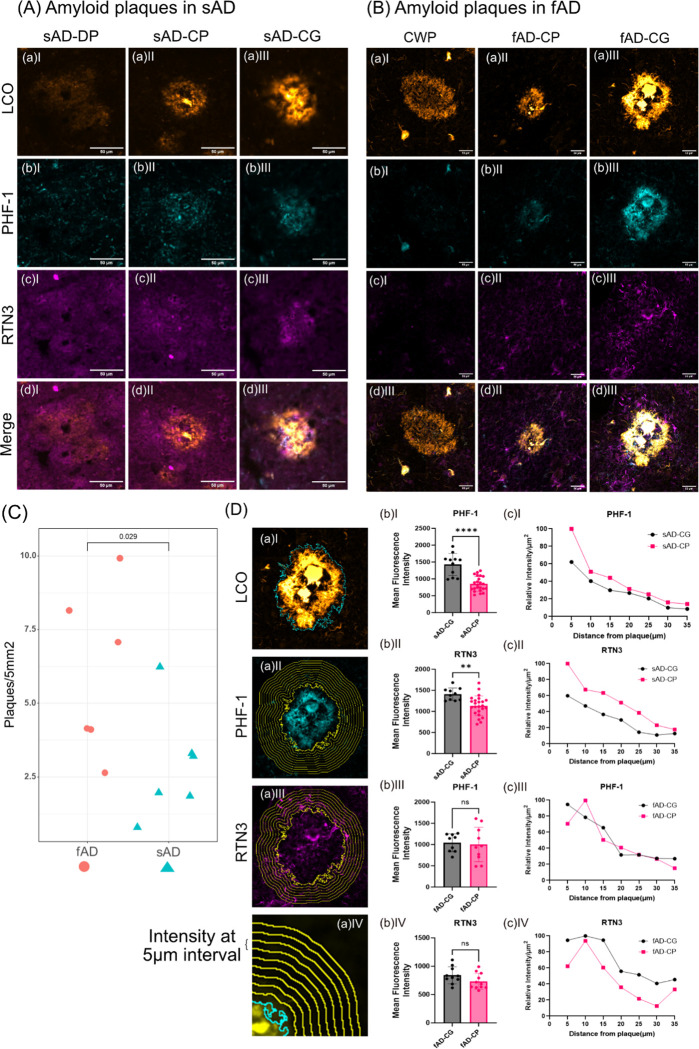
Figure 4. Axonal and dystrophic neurites in Aβ plaque pathology.
Combination of two different Luminescent Conjugated Oligothiophenes (LCOs), namely Quadro-formyl thiophene acetic acid (q-FTAA) and Hepta-formyl thiophene acetic acid (h-FTAA) is employed to stain different amyloid polymorphs like (A) diffuse plaques, cored plaques and coarse grain plaques. LCOs stain premature amyloid fibrils in the (a)I diffuse plaques, (a)II densely packed matured amyloid fibrils in the core of the cored plaques and premature fibril in the corona of the cored plaque and (a)III a relatively homogenous distribution of the amyloid fibrils across the coarse grain plaques in sAD. (b) Localization of the PHF-1 staining of the same plaques indicates almost no to very feeble colocalization in diffuse and in cored plaques while a prominent colocalization of qhFTAA with PHF-1 is observed in the case of coarse grain plaques. (c) Similar RTN3 indicates dystrophic neurites. (d)I Mean fluorescent intensity of d(I) RTN3 in sAD-CG and sAD-CP (d)II PHF-1 in sAD-CG and sAD-CP. (B) Similarly, (a)I cotton wool plaques, (a)II densely packed matured amyloid fibrils in the core of the cored plaques and premature fibril in the corona of the cored plaque and (a)III coarse grain plaque. (b) Localization of the PHF-1 staining of the same plaques indicates almost no to very feeble colocalization in cotton wool plaques and in cored plaques while a prominent colocalization of qhFTAA with PHF-1 is observed in the case of coarse grain plaques. (c) Similarly, RTN3 indicates dystrophic neurites. (C) Higher plaque density (No. of plaques/5mm2) in fAD than sAD. (D) Fluorescent intensity profile circumventing the plaques was measured from CG and CP from both sAD and fAD cases. These value were captured from (b) PHF-1 (Alexafluor594) channel, (c) RTN3 (Alexafluor647) channel (d) at 5μm interval (up to 35μm). Mean fluorescent intensity of the plaque occupied area for (b)I PHF-1 in sAD-CG and sAD-CP, (b)II RTN3 in sAD-CG and sAD-CP, (b)III PHF-1 in fAD-CG and fAD-CP and (b)IV RTN3 in fAD-CG and fAD-CP. and relative change of intensity at (D aIV) 5μm interval away from the plaque for (c)I PHF-1 in sAD-CG and sAD-CP, (c)II, RTN3 in sAD-CG and sAD-CP, (c)III, PHF-1 in fAD-CG and fAD-CP and (c)IV RTN3 in fAD-CG and fAD-CP. (Univariate analysis: *p<0.05, **p<0.01, ***p<0.001, ****p<0.0001).

