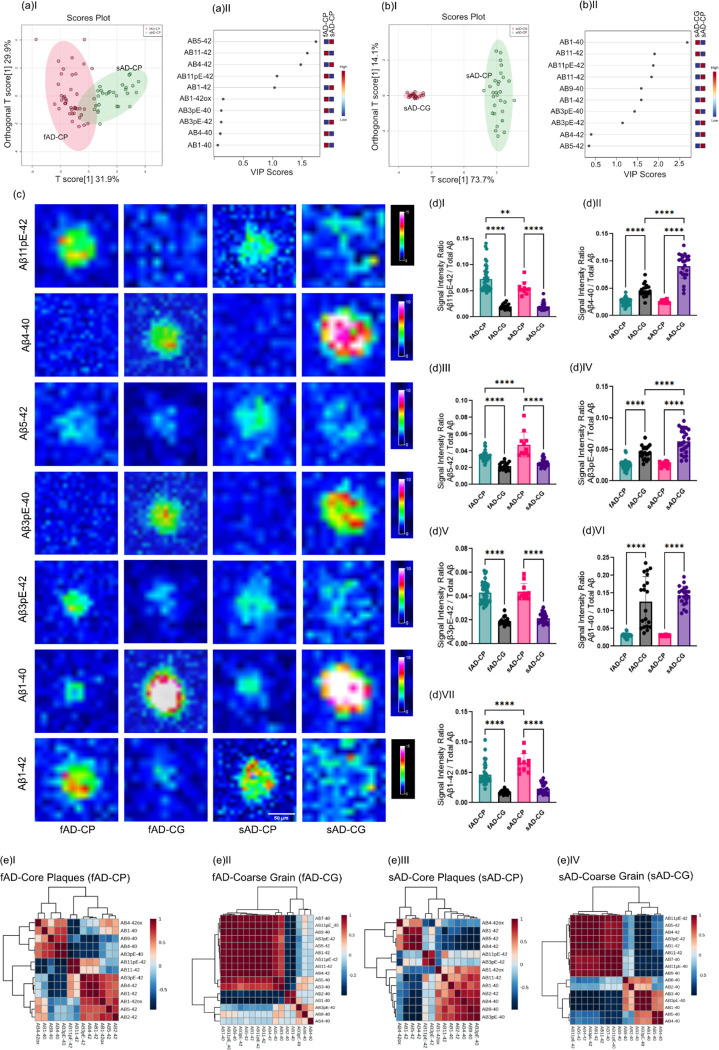
Figure 5. Comparison of peptide patterns in fibrillar plaques:
(aI) OPLS-DA of fAD-CP sAD-CP plaques. indicates the partial separation of fAD CP and sAD CP with (OPLS model characteristics: R2X-0.319; R2Y-0.624; Q2–0.609). (aII) VIP scores. (b I) OPLS-DA of sAD-CP and sAD-CG plaques show strong separation (OPLS model characteristics: R2X-0.737; R2Y-0.948; Q2–0.947). (bII) VIP scores. (c) Single ion images of amyloidβ (Aβ) peptides. (d) Corresponding box plots showing univariate comparison of single ion intensities with respective plaque types. (e) Pearson’s correlation matrix of Aβ peptides in (e)I fAD-CP, (e)II fAD-CG, (e)III sAD-CP (e)IV sAD-CG plaques.

