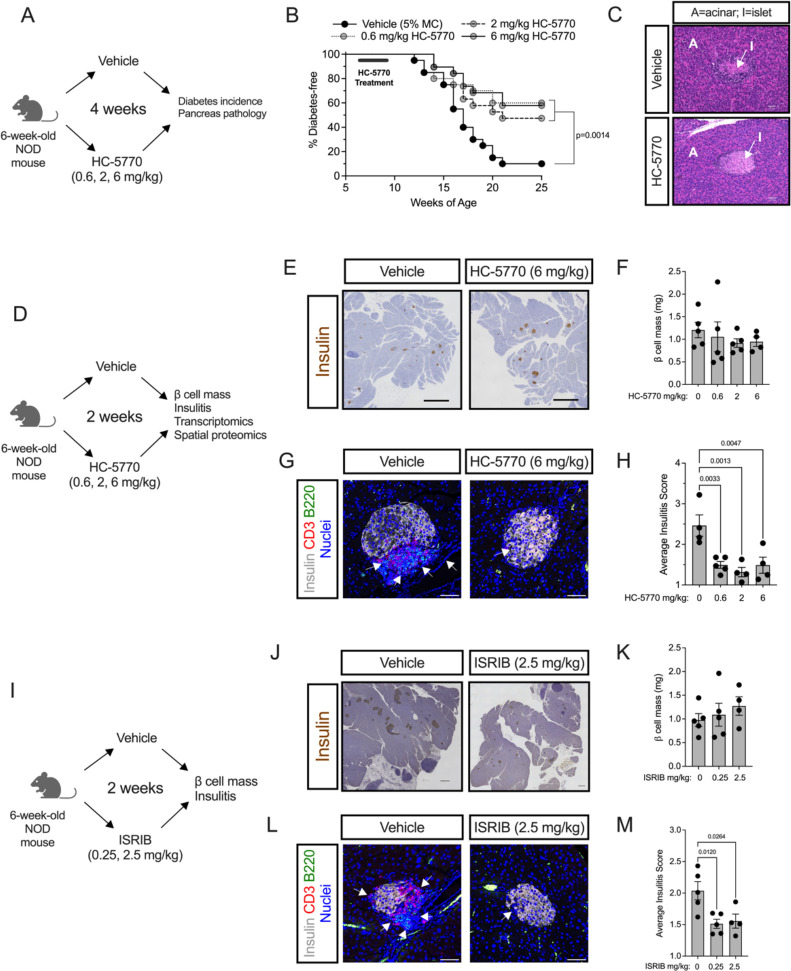
Figure 2: PERK inhibition delays autoimmune diabetes in NOD mice.
Prediabetic female NOD mice (6 weeks of age) were treated with varying doses of HC-5770 or ISRIB. (A) Experimental design for HC-5770 diabetes incidence study. (B) Diabetes incidence. N=20 mice per group (Mantel-Cox). (C) Representative hematoxylin and eosin stain of pancreata from non-diabetic mice at 25 weeks of age that were treated with Vehicle or 6 mg/kg HC-5770 from 6–10 weeks of age. (D) Experimental design for HC-5770 mechanistic short-term studies. (E) Representative images of pancreata from NOD mice following two weeks of HC-5770 administration (6 mg/kg) stained for insulin (brown) and counterstained with hematoxylin (blue); scale bar = 500 μm. (F) β cell mass of mice treated with HC-5770 (6 mg/kg) for two weeks; N=4–5 mice per group (ANOVA). (G) Representative images of pancreata from NOD mice following two weeks of HC-5770 administration (6 mg/kg) immunostained for CD3 (red), B220 (green), insulin (white), and nuclei (blue); arrows indicate regions of insulitis; scale bar = 50 μm. (H) Average insulitis score of mice treated with varying doses of HC-5770 for two weeks; N=4–5 mice per group; NB: these data are replicated in Supplemental Figure 2F for comparative purposes (ANOVA). (I) Experimental design for ISRIB short-term studies. (J) Representative images of pancreata from NOD mice following two weeks of ISRIB administration (2.5 mg/kg) stained for insulin (brown) and counterstained with hematoxylin (blue); scale bar = 500 μm. (K) β cell mass of mice treated with ISRIB (2.5 mg/kg) for two weeks; N=4–5 mice per group (ANOVA). (L) Representative images of pancreata from NOD mice following two weeks of ISRIB administration (2.5 mg/kg) immunostained for CD3 (red), B220 (green), insulin (white), and nuclei (blue); arrows indicate regions of insulitis; scale bar = 50 μm. (H) Average insulitis score of mice treated with varying doses of ISRIB for two weeks; N=4–5 mice per group (ANOVA). Data are presented as mean ±SEM.

