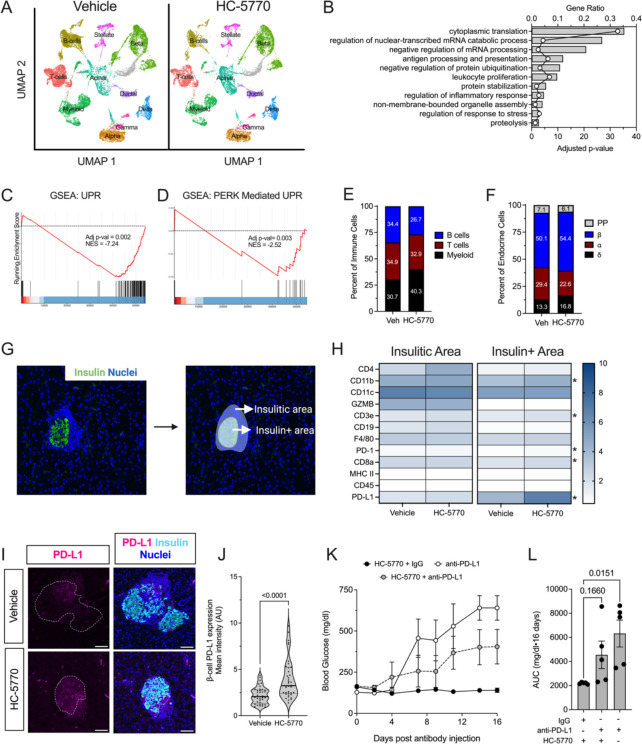
Figure 3: PERK inhibition increases levels of PD-L1 in β cells of NOD mice.
Prediabetic female NOD mice (6 weeks of age) were treated with 6 mg/kg HC-5770 for 2 weeks and isolated islets were subjected to scRNA-seq and pancreas tissue was subjected to Nanostring® spatial proteomics. (A) Uniform manifold approximation and projection (UMAP) embeddings of merged single-cell RNA sequencing profiles from islets colored by identified cell clusters. N=3 mice per group for scRNA-seq. (B) Gene Ontology analysis of all cell clusters (pseudo-bulk analysis). (C) Gene set enrichment analysis (GSEA) of β cell clusters showing HALLMARK: unfolded protein response and (D) GSEA of β cell clusters showing GO-BP: PERK-meditated unfolded protein response. (E) Percent of T, B, and myeloid cells identified within the immune cell clusters. (F) Percent of α, β, δ, and PP cells identified within the islet cell clusters. (G) Representative image of identification of the insulin-positive area and the insulitic area used to collect spatial tissue-based proteomics. (H) Heatmap of identified proteins in the insulitic area (left panel) and insulin-positive area (right panel) in Vehicle- or HC-5770-treated mice; N=10–11 regions of interest from 2 mice per group. * indicates P<0.05 (T-test). (I) Representative images of pancreata from mice following two weeks of treatment with Vehicle or HC-5770 stained for PD-L1 (magenta), insulin (cyan), and nuclei (blue); dotted lines indicate islets; scale bar=50 μm. (J) Quantification of PD-L1 intensity in the β cells of the panel (I); each dot represents an islet, N=4–5 mice, and N>5 islets per mouse (T-test). (K) 6-week-old female NOD mice were treated as indicated with 6 mg/kg HC-5770 or with Vehicle for two weeks, then administered either anti-PD-L1 or IgG control, followed by another two weeks of HC-5770 treatment until 10 weeks of age, and glucoses were measured on alternate days post-injection; N= 5 mice per group. (L) Area Under the Curve (AUC) analysis of the data in panel (K) (ANOVA). Data are presented as mean ±SEM.

