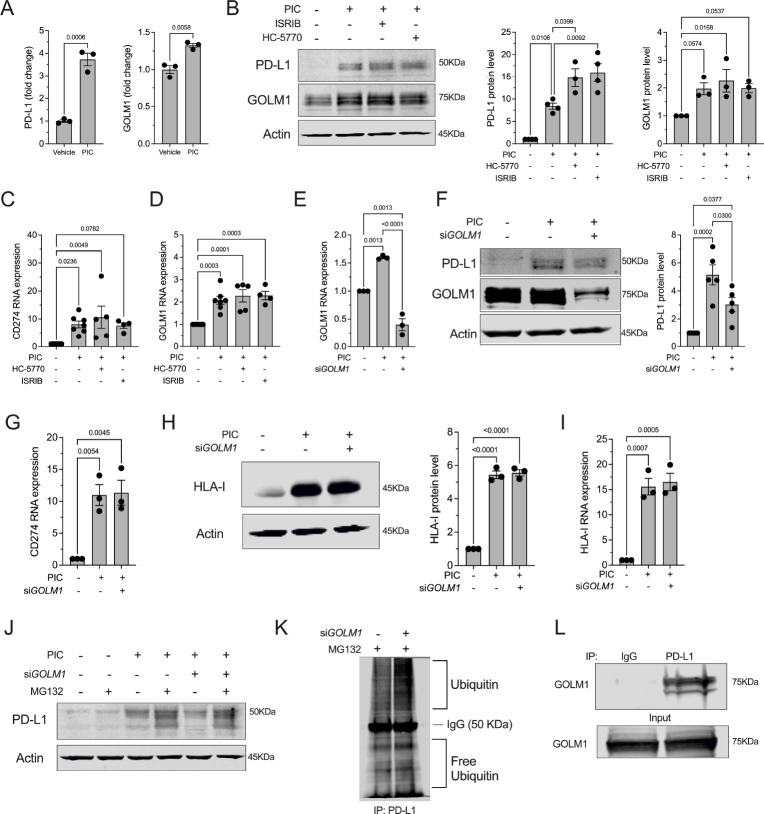
Figure 4: GOLM1 stabilizes PD-L1.
(A) PD-L1 and GOLM1 protein levels were identified using proteomics of EndoC-βH1 human β cells treated ±proinflammatory cytokines (PIC); N=3 biological replicates. T-test. (B) Representative immunoblot analysis of PD-L1 and GOLM1 from EndoC-βH1 cells treated ±PIC, HC-5770, and ISRIB (left panel) with quantification of PD-L1 levels (middle panel) and GOLM1 levels (right panel); N=3 biological replicates (ANOVA). (C, D) Relative CD274 and GOLM1 mRNA levels by quantitative RT-PCR normalized to ACTB from EndoC-βH1 cells treated ±PIC, HC-5770, and ISRIB; N=4–7 biological replicates (ANOVA). (E) Relative GOLM1 RNA levels normalized to ACTB from EndoC-βH1 cells treated ±PIC and GOLM1 siRNA; N=3 biological replicates (ANOVA). (F) Representative immunoblot analysis of PD-L1 and GOLM1 from EndoC-βH1 cells treated ±PIC and GOLM1 siRNA (left panel) with quantification of PD-L1 levels (right panel); N=3 biological replicates (ANOVA). (G) Relative CD274 mRNA levels by quantitative RT-PCR normalized to ACTB of EndoC-βH1 cells treated ±PIC and GOLM1 siRNA; N=3 biological replicates (ANOVA). (H) Representative immunoblot analysis of HLA-I from EndoC-βH1 cells treated ±PIC and GOLM1 siRNA (left panel) with quantification of HLA-I levels (right panel). N=3 biological replicates (ANOVA). (I) Relative HLA-I mRNA levels by quantitative RT-PCR normalized to ACTB from EndoC-βH1 cells treated ±PIC and GOLM1 siRNA; N=3 biological replicates (ANOVA). (J) Representative immunoblot analysis of PD-L1 from EndoC-βH1 cells treated ±PIC, GOLM1 siRNA, and MG132. (K) Immunoblot analysis of ubiquitin following immunoprecipitation (IP) for PD-L1 from HEK-293 cells treated with GOLM1 siRNA ±MG132. (L) Immunoblot analysis for GOLM1 following IP for PD-L1 from HEK-293 cells. Data are presented as mean ±SEM.

