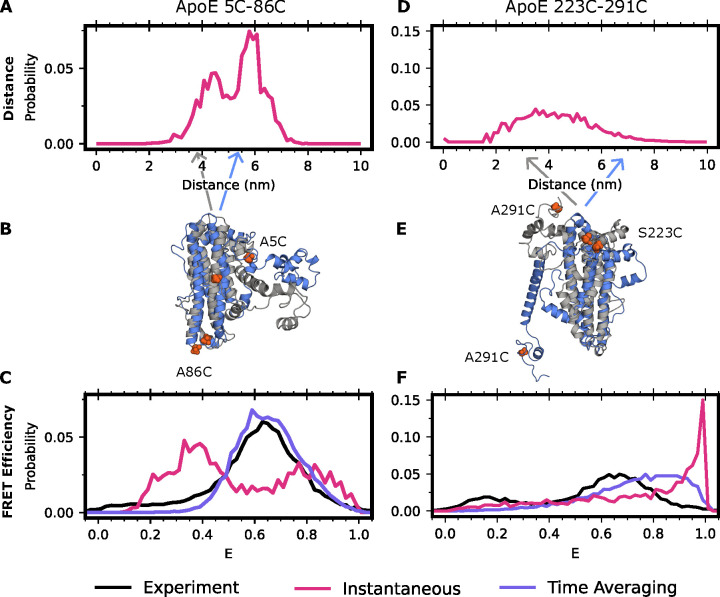
Figure 1: Accounting for time averaging significantly alters the apparent structural distribution from our model and increases agreement with experiments.
(A) Inter-dye distances for apolipoprotein E labeled with Alexafluor 488 and Alexafluor 594 at positions 5 and 86 or (D) 223 and 291. In red is the equilibrium (instantaneous) distribution accounting for the distance added or subtracted by dye positioning (B,E) Exemplar structures of ApoE at two distinct dye-distance positions. Arrows indicate the portion of the distance distribution the structure occupies. (C) FRET efficiencies obtained for positions 5 and 86 or (F) 223 and 291. In black is the experimental distribution, in red is the result when not accounting for conformational dynamics of ApoE, and in purple is the time-averaged trace of the red trace.

