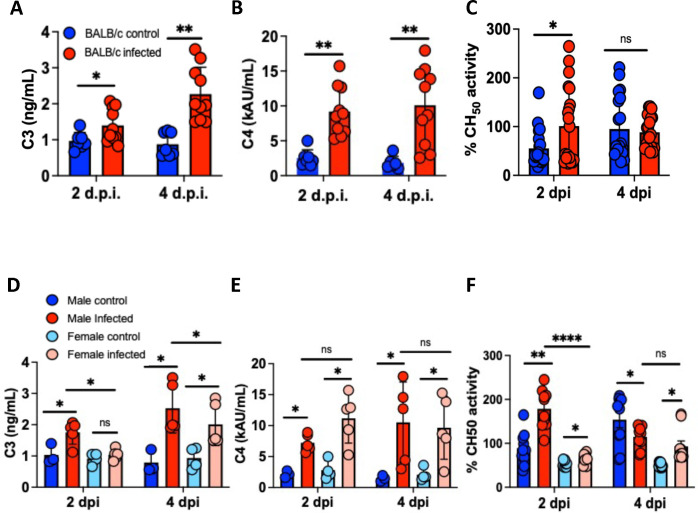
Figure 6.
Characterization of systemic complement activity in mice infected with SARS2-N501YMA30. (A and B) Serum C3 and C4 ELISA from control (blue) and infected (red) mice on 2 and 4 dpi. (C) Serum CH50 activity assay from control (blue) and SARS2-N501YMA30 mice (red). Comparison of sex difference by serum ELISA for C3 (D) and C4 (E) on 2 and 4 dpi, with data from sex specific CH50 activity assay shown in (F). dpi = days post-infection. Significance determined by one-way ANOVA or unpaired t-test, * p<0.05, ** p<0.001, **** p<0.00001. ns = nonsignificant. C3 and C4 measured from n = 7. DMEM and n = 10 SARS2-N501YMA30 mice per group. CH50 assay from n = 10 mice per group, samples run in duplicate.

