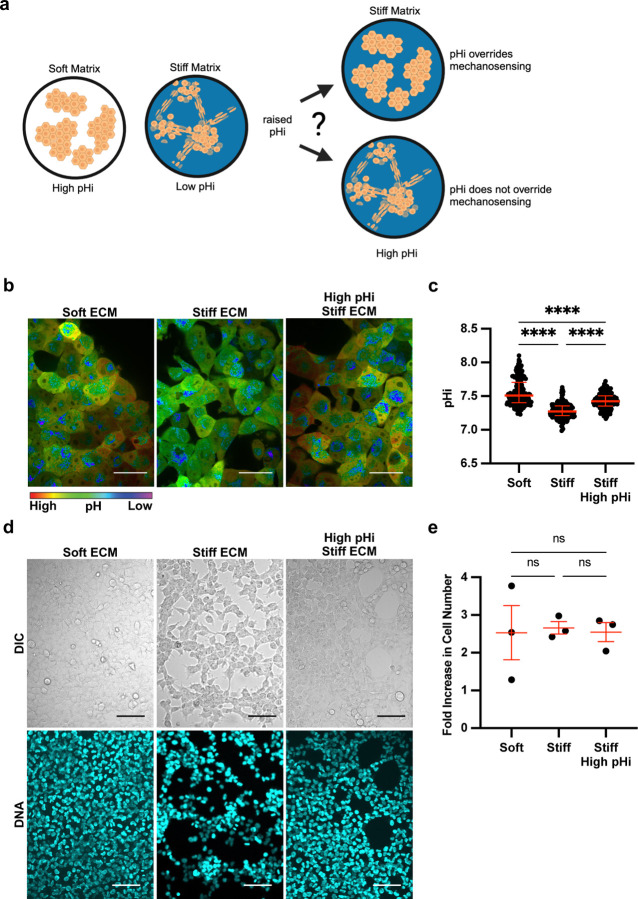
Figure 2: Stiffness-dependent vasculogenic mimicry is reduced when pHi is increased on stiff ECM.
a) Schematic of vasculogenic mimicry (VM) in 2D on stiffening matrix. b) Representative images of H1299 cells stably expressing mCherry-pHluorin pH biosensor plated on soft (0.5% PEGDA) and stiff (4% PEGDA) HA gels and stiff (4% PEGDA) with raised pHi. Images show ratiometric display of pHluorin/mCherry fluorescence ratios. Scale bars: 50 μm. c) Quantification of single-cell pHi data collected as shown in (b) (n=3 biological replicates; n=201 soft, n=237 stiff, n=239 stiff high pHi. Red lines show medians ± IQR). d) Representative images of H1299 cells plated on soft (0.5% PEGDA) and stiff (4% PEGDA) HA gels. Images show differential interference contrast (DIC) and Hoechst stain (DNA, cyan). Scale bars: 100 μm. e) Quantification of cell proliferation across manipulation conditions. (n=3 biological replicates, n=9 per condition. Red lines show means ± SEM).

