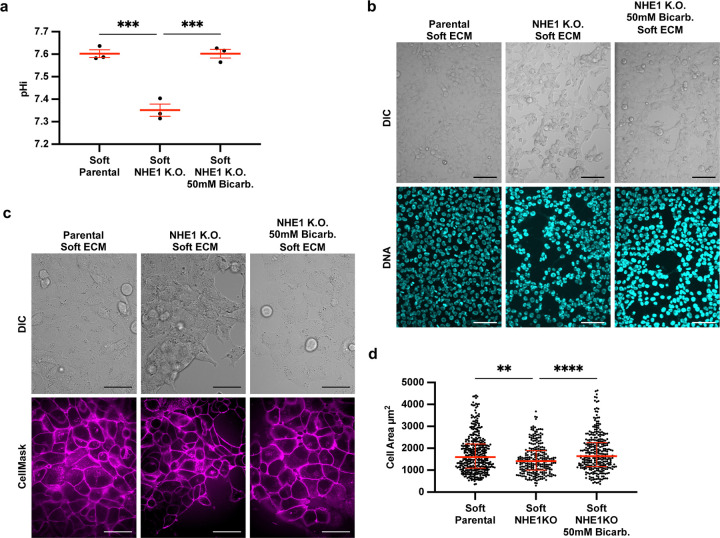
Figure 5: Low pHi is sufficient to induce vasculogenic mimicry on a soft ECM.
a) Quantification of pHi data from parental H1299 cells and H1299 cells where NHE1 knockout via CRISPR (H1299-NHE1 K.O.). with and without treatment with sodium bicarbonate (Bicarb.) (see methods) (n=3 biological replicates. n=9 parental, n=18 NHE1 K.O., n=18 NHE1 K.O. Bicarb. Red lines show means ± SEM). b) Representative images of H1299 cells plated on soft HA gels (0.5% PEGDA) with and without lowered pHi (H1299-NHE1 K.O.) and with or without increased pHi (H1299-NHE1 K.O. Bicarb.). Images show differential interference contrast (DIC) and Hoechst 33342 (DNA, cyan). Scale bars: 100 μm. c) Representative images of H1299 cells plated on soft HA gels (0.5% PEGDA) with and without lowered pHi (H1299-NHE1 K.O.) and with or without increased pHi (H1299-NHE1 K.O. Bicarb.). Images show differential interference contrast (DIC) and CellMask Deep Red membrane stain (Cy5, magenta). Scale bars: 50 μm. d) Quantification of single-cell area collected as shown in (a) (n=3 biological replicates, n=383 parental, n=267 NHE1 K.O., n=315 NHE1 K.O. Bicarb. Red lines show medians ± IQR).

