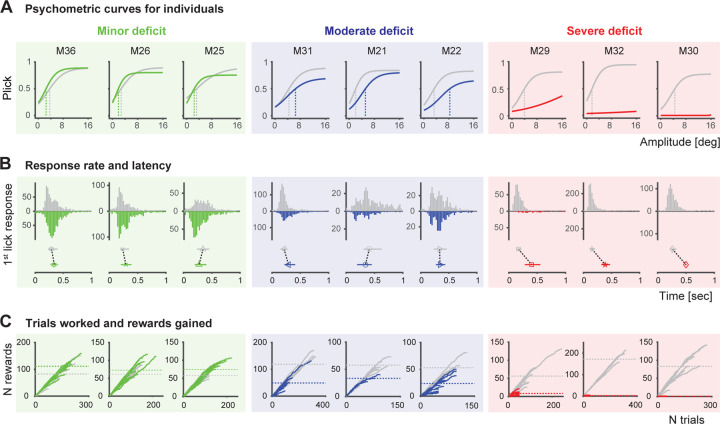
Figure 3. Assessment of sensory capabilities in different individuals.
A. Psychometric curves and response thresholds for each animal performing the detection task before (gray) and after 6-OHDA injection (colored). Mice are ordered by the performance drop (from left to right). Solid curves are logistic fits to response probabilities with different stimulus amplitudes from an individual, averaged across sessions. Response thresholds at P=0.5 are shown as vertical lines. The difference in response thresholds is used to define the 3 categories: minor deficit (threshpost-pre <1, green, n=3), moderate deficit (threshpost-pre>1 and <10, blue, n=3) and severe deficit (threshpost-pre>10, red, n=3). B. Top: Response (1st lick) latencies of individual mice before and after 6-OHDA injection shown as histograms. Bottom: Median 1st lick latencies with percentiles. C. Number of rewards (correct trials) accumulated as a function of trials worked by each animal before and after 6-OHDA injection. Each line corresponds to one session. Dashed horizontal lines correspond to the total rewards per session on average. Figure conventions and order are the same as in A.

