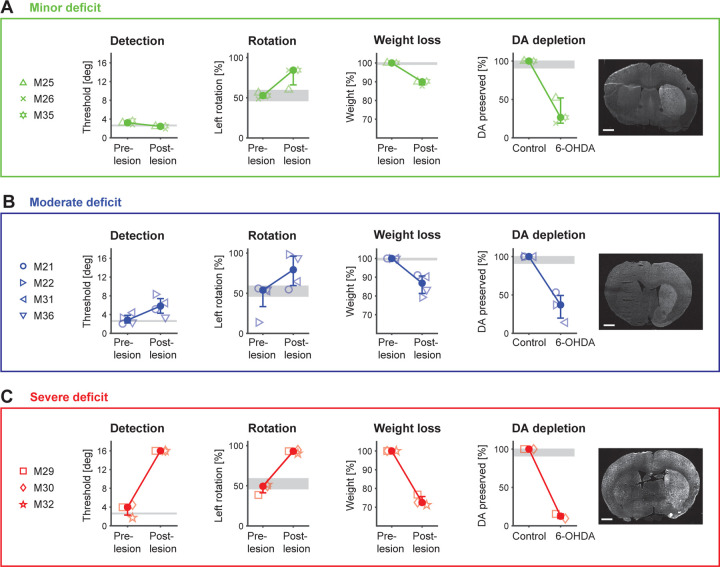
Figure 5. Comparison of multiple behavioral metrics and DA depletion in the 6-OHDA mouse model.
A. Minor deficit group (n=3). Detection: Perceptual thresholds (at P=0.5) from the detection task for all mice before and after the 6-OHDA lesion. Rotation: Percent left turns performed by animals in the rotameter test before and after 6-OHDA lesion. Weight loss: Maximum weight loss during the recovery period for each animal. DA depletion: Left. The percentage of DA preservation is quantified from histological analysis for all mice of this group. Right. Coronal sections of an example mouse after 6-OHDA-lesion, stained for tyrosine hydroxylase (TH) expression. B. Same metrics for the moderate deficit group (n=4). C. Same metrics for the severe deficit group (n=3). Symbols represent individual mice. Solid filled circles represent medians across mice with percentiles. Gray areas represent median range across sham operated mice (n=2). Note, histological assessment was performed for a subset of mice (minor deficit n=3; moderate deficit n=3.; severe deficit n=2). Scale bars: 1 mm.

