
Figure 1: LRRK2 mediates the effects of haloperidol on movement disruption.
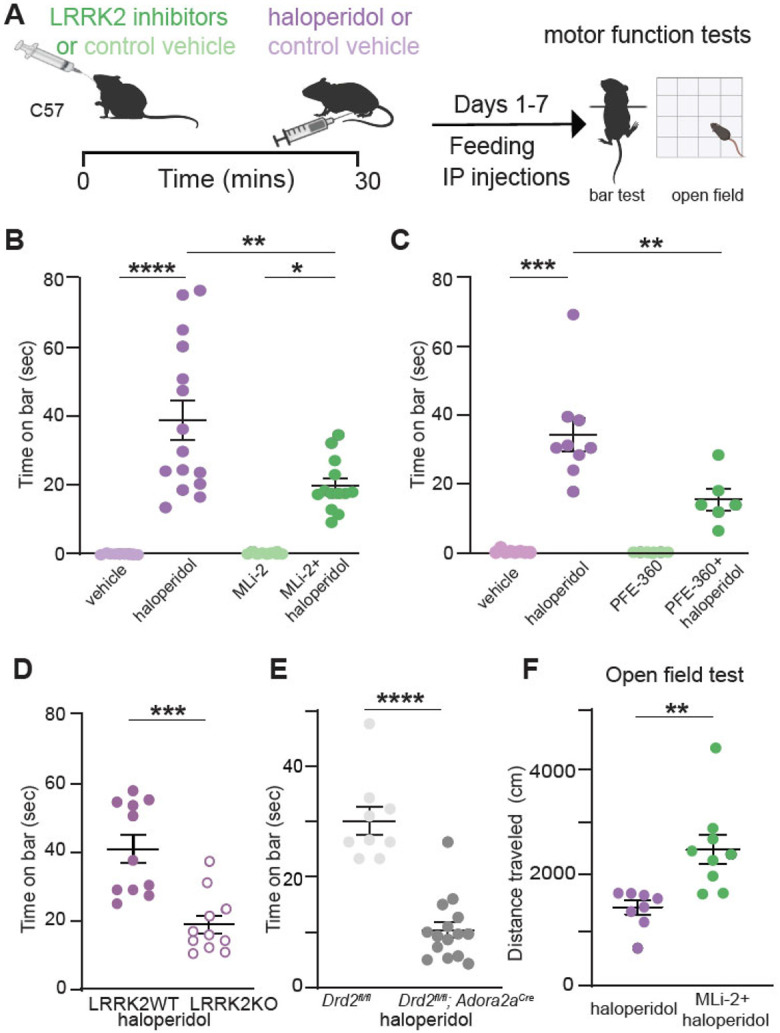
A. Schematic of the experiment and treatment schedule. Catalepsy was assessed with the bar test, and distance traveled was recorded in an open-field arena; both were performed 1 hr after the final treatment administration. Treatment conditions: Vehicle for MLi-2, 40% 2-hydroxypropyl-β-cyclodextrin; MLi2, 10 mg/kg; vehicle for PFE-360, 1.25% hydroxypropyl cellulose + 0.5% docusate sodium; PFE-360, 5 mg/kg; vehicle for haloperidol, saline (0.9% NaCl); haloperidol, 1 mg/kg. Some schematics were created with BioRender.com. X axis: vehicle = vehicle for MLi-2+ vehicle for haloperidol; haloperidol = vehicle for MLi-2+haloperidol; MLi-2 or PFE-360 = MLi-2 or PFE-360+vehicle for haloperidol; MLi-2 or PFE-360+haloperidol, as indicated. All drugs were administered intraperitoneally (i.p.) except MLi-2, PFE-360, and their vehicles, which were given orally.
B. Cataleptic response of WT mice receiving haloperidol, MLi-2, their combination, and vehicle controls for 7 days. N=9, 15, 8, 13 mice, in order of groups presented.
C. Same as B, but using PFE-360, and its corresponding vehicle. N=8, 9, 6, 6 mice, in order of groups presented.
D. Cataleptic response of LRRK2-WT and LRRK2-KO mice receiving haloperidol or control vehicle for 7 days. N=11 mice for both genotypes.
E. Cataleptic response of Drd2fl/fl and Drd2fl/fl; Adora2acre mice receiving haloperidol for 7 days. N=9 and 15 mice, respectively.
F. Distance traveled in the open-field test for WT mice receiving haloperidol or haloperidol + MLi-2. N=8 and 9 mice, respectively. Data are represented as mean±SEM. Asterisks in B-C show statistical significance for Tukey's multiple comparison tests after one-way ANOVA; *p < 0.05, **p< 0.01, ***p < 0.001, ****p < 0.0001. Asterisks in D-F show statistical significance for unpaired t-test comparison; **p< 0.01,***p < 0.001, ****p < 0.0001.