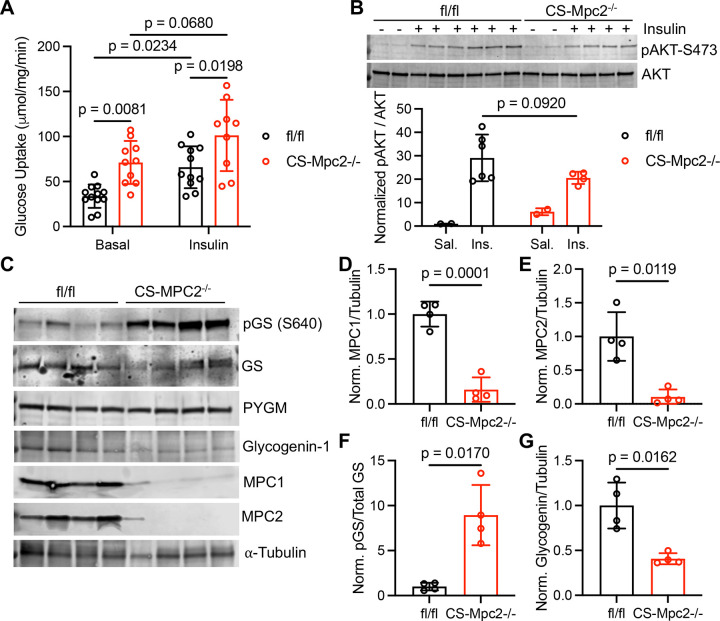
Figure 3. Glucose uptake is increased, and glycogen synthesis should be inhibited in CS-Mpc2−/− hearts.
A, Glucose uptake assessed by 2-deoxyglucose in the present or absence of insulin in cardiac muscle fibers from fl/fl and CS-Mpc2−/− littermates, n=9–12. B, Western blot images of phosphorylated (serine-473) and total protein kinase B (AKT) and the ratio of quantified densitometry for pAKT/AKT from hearts of fl/fl and CS-Mpc2−/− mice injected with either saline vehicle or 5mU/g insulin. C through G, Western blot images of phosphorylated glycogen synthase (pGS) serine-640, total glycogen synthase (GS), muscle glycogen phosphorylase (PYGM), glycogenin-1, mitochondrial pyruvate carrier (MPC) 1, MPC2, and α-tubulin (C), and the normalized densitometry quantification for MPC1/tubulin (D), MPC2/tubulin (E), pGS/total GS (F), and glycogenin-1/tubulin (G) in hearts of fl/fl and CS-Mpc2−/− littermates, n=4. Data are presented as the mean±SD. Data in A were evaluated by two-way analysis of variance (ANOVA) with Tukey post-hoc multiple-comparisons test. Data in B were evaluated by unpaired, two-tailed Student’s t-test with Welch correction due to only n=2 in saline groups. Data in D-G were evaluated by unpaired, two-tailed Student’s t-test with Welch correction.

