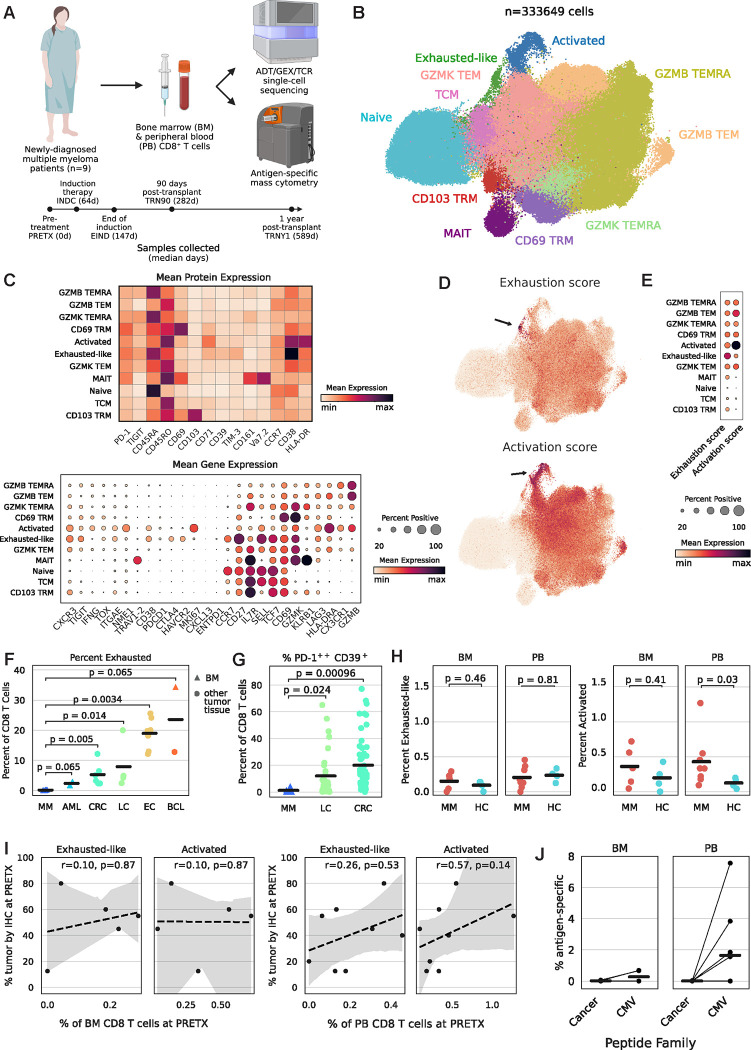
Figure 1: Hallmarks of tumor-experienced T cells are absent in NDMM.
1A: Experimental diagram and clinical time course. ADT=antibody-derived tag; GEX=gene expression; TCR=T cell receptor.
1B: TotalVI-UMAP of CD8+ T cells colored by cluster.
1C: Mean expression of proteins (top) or genes (bottom) by cluster.
1D: TotalVI-UMAP of CD8+ T cells colored by gene set score.
1E: Mean gene set score by cluster.
1F: PRETX frequency of exhausted-like/exhausted T cells quantified by single-cell sequencing, including public data,5–8 and separated by tumor type; p calculated by Wilcoxon rank sum test. AML=acute myeloid leukemia; CRC=colorectal cancer; LC=lung cancer; EC=esophageal cancer; BCL=B cell lymphoma.
1G: PRETX frequency of PD-1++CD39+ T cells quantified by mass cytometry, including public data,9 and separated by tumor type; p calculated by Wilcoxon rank sum test.
1H: Frequency of exhausted-like (left) or activated (right) cells in NDMM patients at PRETX and healthy controls, by tissue; p calculated by Wilcoxon rank sum test.
1I: Frequency of BM (left panel) or PB (right panel) exhausted-like or activated cells (x-axis) and BM tumor cells quantified by clinical immunohistochemistry (y-axis) at PRETX; r and p calculated by Spearman method.
1J: PRETX frequency of pMHC-tet+CD8+ T cells by peptide family and tissue; lines grouped by patient.

