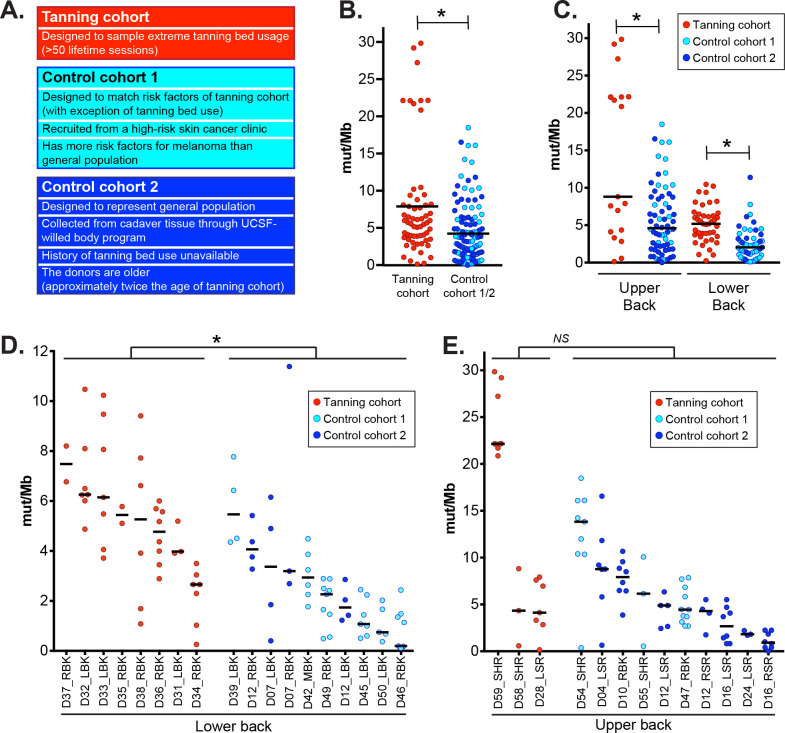
Figure 2. High mutation burdens in melanocytes from tanning bed users.
A. An overview of the tanning and control cohorts. In panels B-E, each data point corresponds to the mutation burden (measured in mutations per megabase) of an individual melanocyte with black bars indicating median mutation burdens. Asterisks denote p-values less than 0.05 (Wilcoxon rank-sum test). B. A comparison of all melanocytes from tanning bed donors to all melanocytes from control donors. C. A comparison of melanocytes from tanning bed donors to control donors, separately for each anatomic site. D. A comparison of biopsy mutation burdens from tanning bed donors to control donors on the lower back. The mutation burden of each biopsy was calculated from the median mutation burden of its constituent melanocytes. E. A comparison of biopsy mutation burdens from tanning bed donors to control donors on the upper back.

