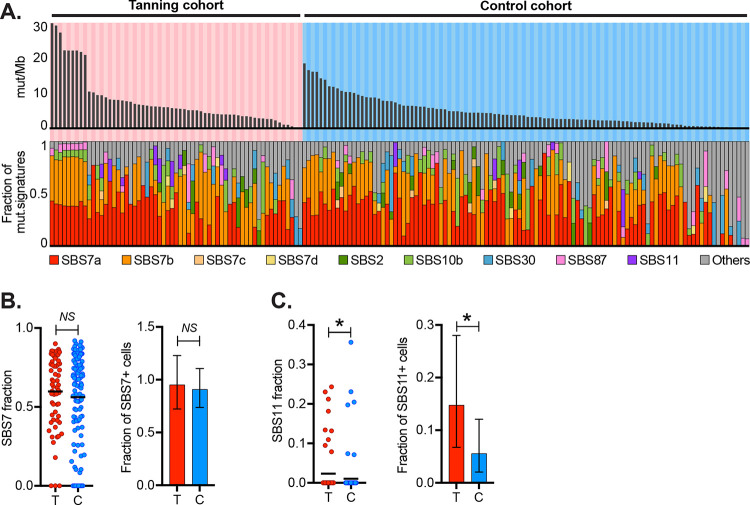
Figure 3. Distinct types of mutations between melanocytes in tanning bed donors versus control donors.
A. The top panel depicts the mutation burden (mut/Mb) of melanocytes with each column representing a single melanocyte, arranged in descending order for each cohort. The middle bar graph shows the fraction of mutations from UV radiation (CC>TT or (C/T)C>T). The bottom panel shows the fractions of different mutation signatures for each melanocyte. B. The left scatter plot shows proportions of signature 7 in melanocytes from the tanning cohort (T) and control cohort (C) (p-value: 0.609, Wilcoxon rank-sum test). The right bar graph compares the fraction of melanocytes with any detectable signature 7 in each cohort (p-value: 0.6867, Poisson test). C. Data is plotted as described in the previous panel but for signature 11 (p-value: 0.0405, Wilcoxon rank-sum test on the left, and p-value: 0.00813, Poisson test on the right).

