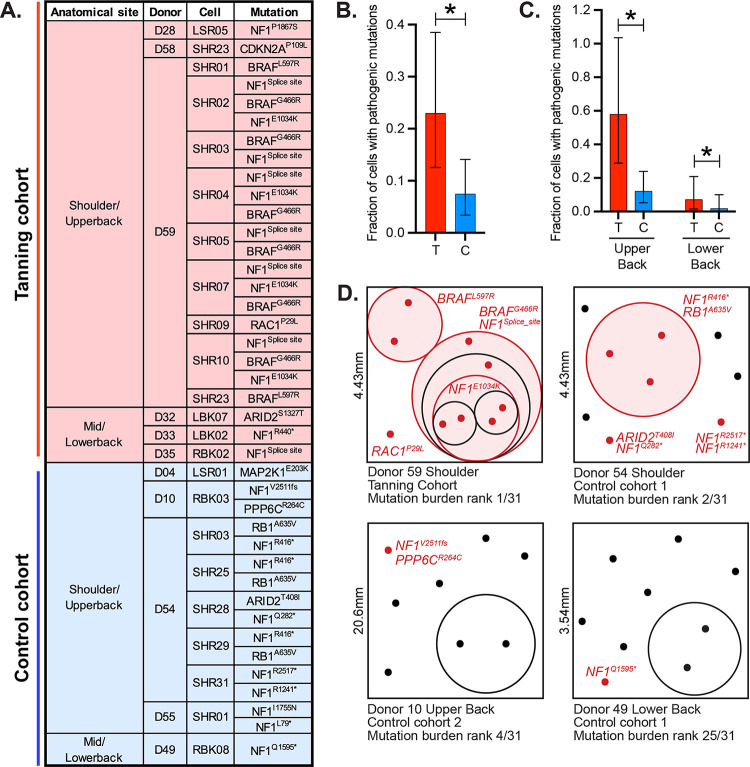
Figure 4. Pathogenic mutations are common in melanocytes from tanning bed users.
A. A list of pathogenic mutations observed, broken down by cohort, body site, donor, and cell. B. The fraction of cells with pathogenic mutations in tanning bed users (T) or control donors (C). Asterisk indicates p-value less than 0.05 (Poisson test) with error bars showing 95% confidence intervals. C. Data is plotted as in panel B, but here, cells are broken down by anatomic site. D. Four biopsies had 2 or more melanocytes with shared subsets of mutations. In these schematics, each dot represents an individual melanocyte, and phylogenetically related melanocytes are circled. Melanocytes with pathogenic mutations are noted in red with their driver mutations labeled. The true spatial localization of each cell, within biopsies, is unknown, but these schematics attempt to illustrate field sizes and clonal distribution of skin biopsies.

