
Figure 4. MORC2 can capture circular DNA substrates.
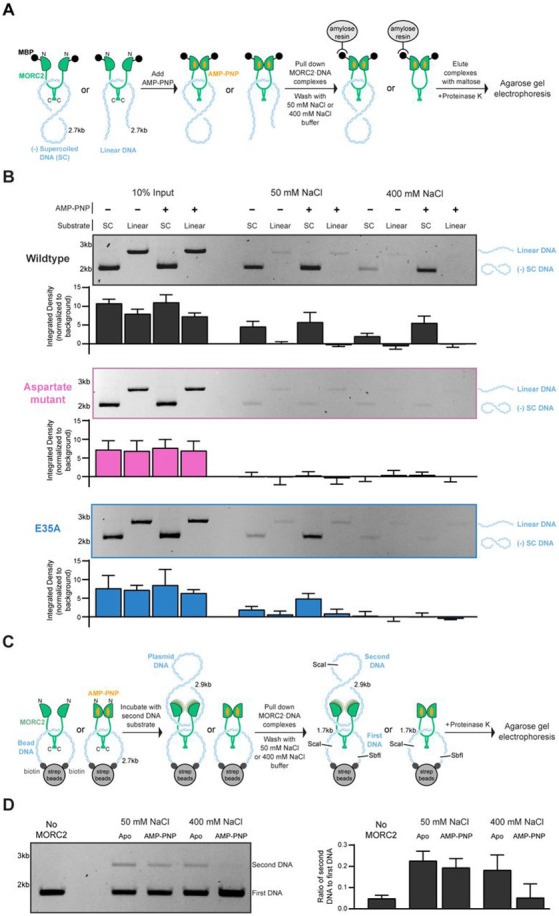
A. Schematic of assay to assess MORC2 capture of linear or circular DNA substrates.
B. N-terminally-maltose binding protein (MBP)-tagged wildtype, aspartate mutant, and E35A MORC2 (600 nM) were incubated with 100 nM supercoiled or linear pUC19. Samples were then added to amylose resin and washed in either low salt (50 mM NaCl) or high salt (400 mM NaCl) containing buffers before eluting the samples from the beads with maltose. Eluted samples were treated with proteinase K. DNA was resolved on a 1% (w/v) TAE agarose gel. Quantification of the band intensity from input and retained DNA bands normalized to the background are shown below each gel. Error bars correspond to the standard deviation between three replicate experiments.
C. Schematic of assay to assess MORC2 association with two circular DNA substrates.
D. A biotin tagged DNA was conjugated to streptavidin magnetic beads to create a pseudo circular substrate. MORC2 (600 nM) was incubated with 20 μL of the beads in the presence or absence of 1 mM AMP-PNP. Supercoiled pBlueScript plasmid DNA (200 nM) was added before washing the beads with either low salt (50 mM NaCl) or high salt (400 mM NaCl) containing buffer. Samples were resuspended in 1X CutSmart buffer (New England Biolabs). DNA was released from the beads by digestion with ScaI and SbfI at 37°C for 1 hour before proteinase K treatment. DNA was resolved on a 1% (w/v) TAE agarose gel. The intensity of the first DNA and second DNA substrate bands were quantified, normalized to the background, and are presented as a ratio of second DNA: first DNA band intensity. Error bars correspond to the standard deviation between three replicate experiments.