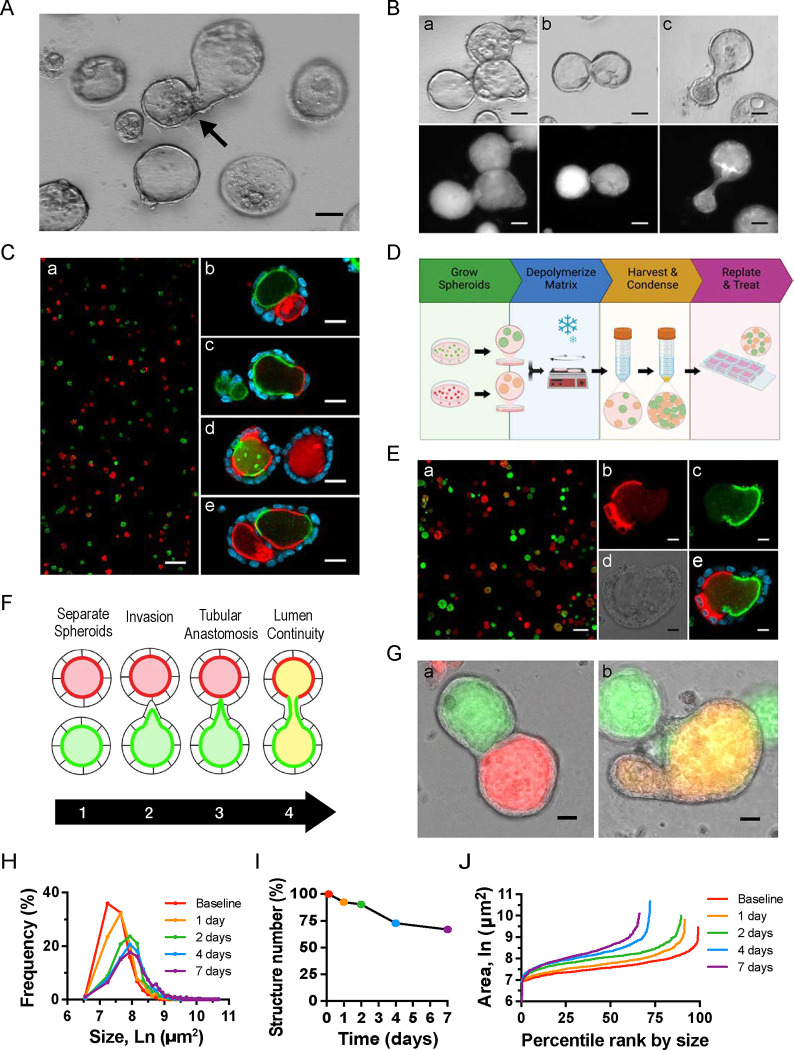
Figure 2. Development of a quantitative assay of spheroid interconnection.
(A) Brightfield imaging of 2-wk-old spheroids depicts non-spherical structures consistent with anastomosis. (B) Brightfield and fluorescent images of GFP-Podxl+ spheroids show asymmetrical protrusions (a), adjacent spheroids with a common basal surface (b), and a dumbbell-shaped structure with a single lumen (c). Images are representative of at least five independent experiments. (A, B) Images are representative of at least five independent experiments. Scale bars = 50 μm. (C) Fluorescent images from experiments in which RFP-Podxl+ and GFP-Podxl+ cells were mixed prior to spheroid formation (a) show single (b), double (c), and intercalated (d,e) fluorescently-labeled lumens. (D) Schematic of new assay in which RFP-Podxl+ and GFP-Podxl+ spheroids are grown separately, harvested, condensed, and replated. (E) Fluorescent images from new assay show single or dual-labeled lumens without intercalation. High magnification fluorescent (b,c,e) and brightfield (d) images of a dual-fluorescent structure are shown. Images are representative of at least ten independent experiments. Scale bars = 200 μm (Ca, Ea), 20 μm (Cb-e), 10 μm (Eb-e) (F) Schematic of the stages of anastomosis. (G-J) Spheroid anastomosis was quantified by four measures: (G) Structures with dual GFP+ and RFP+ fluorescence (tubular anastomosis) shown as percentage of total structures (a). Structures with lumen spectral overlap of GFP+ and RFP+ or ‘yellow’ lumens as percentage of total structures (b). Images are representative of at least ten independent experiments. Scale bars = 20 μm. (H) Frequency distribution of structure cross-sectional area over time. (I) Structure number as percentage of baseline count. This decreases over time due to anastomoses. Spheroid size (H) and number (I) can also be represented in a single graph, as in (J).

