
Figure 2.
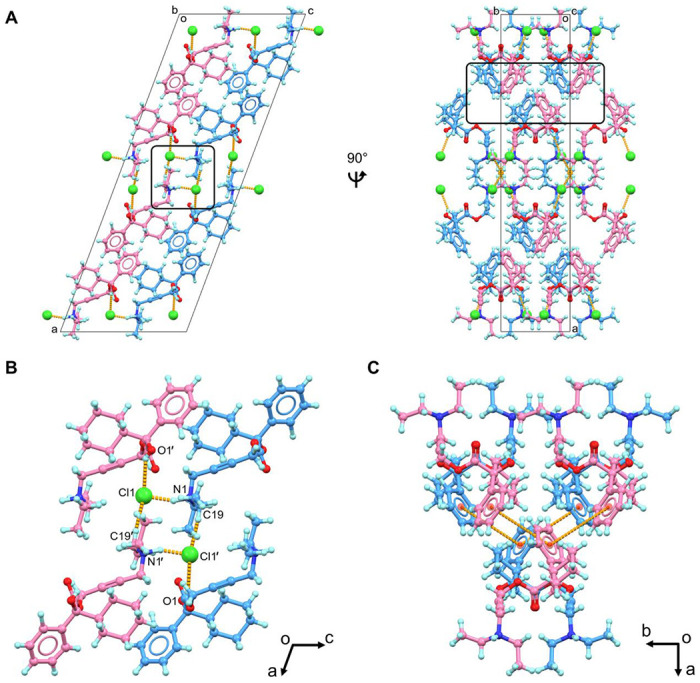
(A) Packing diagram of oxybutynin hydrochloride 1, viewed along b and c axes; (B) Hydrogen bonding interactions in 1, viewed along b axis; (C) Π-stacking interactions in 1 (less than 5 Å). 1R was colored in blue, 1S was colored in violet. Hydrogen bonding and π-stacking interactions were represented by the dashed lines in orange. Cl− anions were highlighted in spacefill style. Extra Cl− anions were omitted in Figures 2B and 2C for clarification.