
Figure 3.
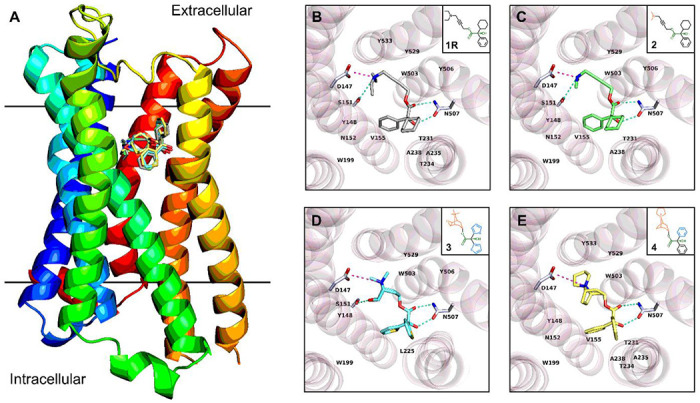
(A) Overlay of protein-drug interaction diagram of complexes between M3R and four antagonists; (B) Topside view of M3R/1R complex structure predicted by molecular docking; (C) Topside view of M3R/2 complex structure predicted by molecular docking; (D) Topside view of M3R/3 complex structure determined by X-ray diffraction (PDB entry: 4U15); (E) Topside view of M3R/4 complex structure predicted by molecular docking. Hydrogen bonding interactions were colored by the dashed line in greencyan, and salt bridges were colored by the dashed line in light magenta. π-stacking, π-cation and hydrophobic interactions were omitted for clarification (see details in Tables S3–S6, Supporting Information). The fusion parts of T4 lysozyme were omitted for clarification. Compounds were symbolled as 1-4: (R)-Oxybutynin 1R, (R)-4-Dimethylamino-2-butynyl-2-cyclohexyl-2-hydroxy-2-phenylacetate hydrochloride 2, Tiotropium 3, Trospium 4.