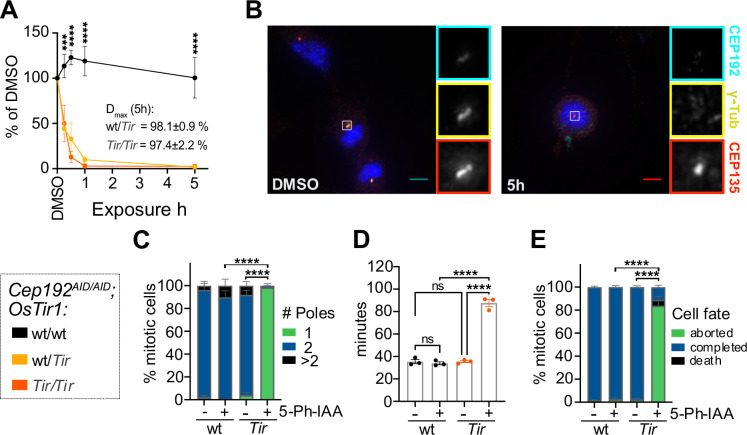
Figure 2: The AID2 system efficiently degrades CEP192AID in primary cultures.
(A) Quantification of NeonGreen (NG) intensity in immunofluorescence microscopy images relative to DMSO in MEF lines of the indicated genotypes treated with 5-Ph-IAA for various times. N = 3–5 MEF lines per genotype.
(B-C) Cep192AID/AID MEFs that were either wt/wt or Tir/Tir for OsTir1 were treated with 5-Ph-IAA (+) or DMSO (−) for 5h. (B) Representative images of OSTIR1 expressing MEFs immunostained for γ-tubulin (yellow) and CEP135 (red). CEP192AID is shown in cyan. Insets show centrosomes in mitotic cells. Scale bar 5 μm. (C) Graph showing the number of mitotic spindle poles quantified in immunofluorescence images as in (B); n = 10–30 mitotic cells in N = 4 MEF lines per genotype.
(D-E) Cep192AID/AID MEFs with or without OSTIR1 expression were treated with 5-Ph-IAA (+) or DMSO (−) and live imaged to determine the duration and fate of mitosis. (D) Quantification of the time spent in mitosis from rounding up until completion of cell division or cell death. (E) Graph showing the cell fate after mitosis: cells completed mitosis by successful division (blue), died (black), or re-adhered without division (green). N = 4 MEF lines per genotype.
All data is displayed as mean ± SEM. Statistical significance was determined using one-way (D) or two-way (A, C, E) ANOVA with Sidak’s multiple comparisons test. ns p≥0.05, *** p<0.001, **** p<0.0001.

