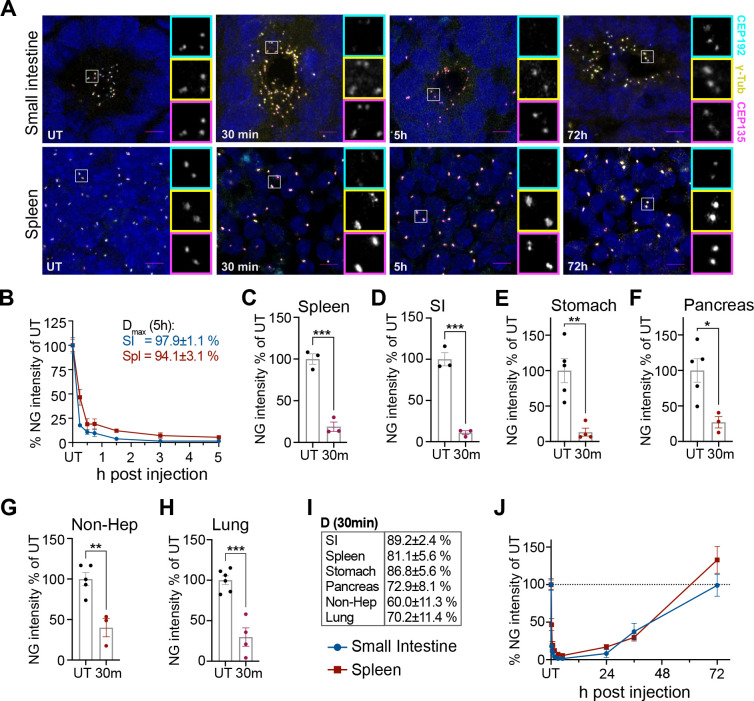
Figure 4: The AID2 system induces rapid and reversible CEP192AID degradation in mice.
(A) Representative confocal images of the small intestine and the spleen of CEP192AID mice expressing OSTIR1 that were left untreated (UT), or analysed at various times after i.p. injection of 5-Ph-IAA. CEP192AID (cyan), γ-tubulin (yellow), CEP135 (magenta); scale bars 5 μm.
(B) Graph showing the CEP192AID intensity (NeonGreen, NG) in the small intestine (SI, blue) and the spleen (red) measured by fluorescence microscopy relative to the untreated (UT) control at 15 min, 30 min, 45 min, 1.5 h, 3 h, and 5 h after i.p. injection. Maximum degradation (Dmax) was reached by 5h.
(C-H) Quantifications of the CEP192AID (NeonGreen, NG) signal intensity in the indicated organs are shown relative to the untreated controls (UT) 30 min after treatment. (G) Since CEP192AID was not expressed in hepatocytes, the signal was quantified in non-parenchymal cells in the liver (Non-Hep).
(I) Table shows the degree of degradation at 30 min for the organs in (C-H).
(J) The CEP192AID signal (NG) was quantified at the indicated time points up to 72h after 5-Ph-IAA injection. Data points for UT and time points up to 5h are the same as in (B). The dashed line indicates 100%; N = 3–6 mice per time point.
Data is shown as mean ± SEM. Statistical significance was determined using a two-tailed, unpaired Student’s t-test, * p<0.05, ** p<0.01, *** p<0.001, **** p<0.0001.

