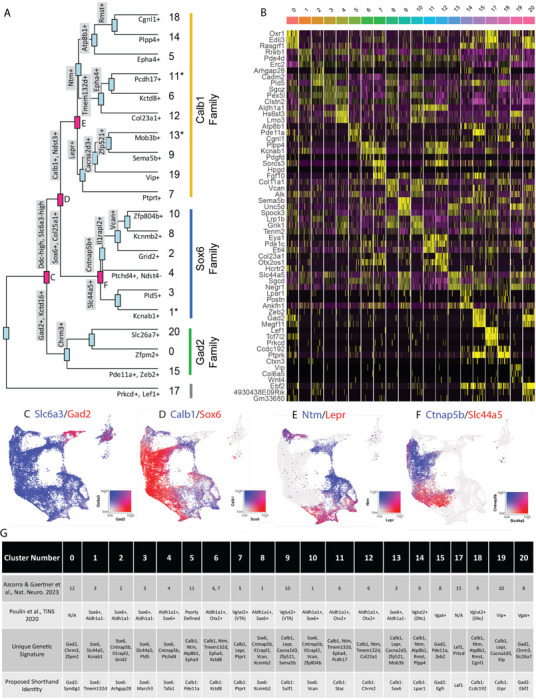
Figure 2.

Mapping subtype identities, marker genes, and relationships to previously described populations. A) Dendrogram of DA neuron subtypes in our dataset. Distance between branch points represent approximations of relatedness between subsequent nodes, and genes labeled at each branch point represent the top differentially expressed genes distinguishing the downstream groups. Subtypes fell largely into three “families,” with expression patterns generally defined by Gad2, Sox6, or Calb1. Notably, clusters 1, 11, and 13 are shown with an asterisk as these do not display differential expression in line with the defining genes of their cluster families (i.e. are not significantly enriched for their eponymous family genes). B) Heatmap of top differentially expression genes for each cluster. The top 3 genes for each cluster are shown. C-F) Coexpression of genes at specified branch points denoted in 2A. G) Table describing putative clusters and relation to previous literature. Top row: cluster number. Second row: Equivalent cluster in Azcorra & Gaertner et al25. Third row: stepwise genetic signatures based on following sequential branch points of cluster dendrogram. Bottom row: Proposed shorthand name for subtypes, based on cluster family and top defining genes for that cluster within each family.
