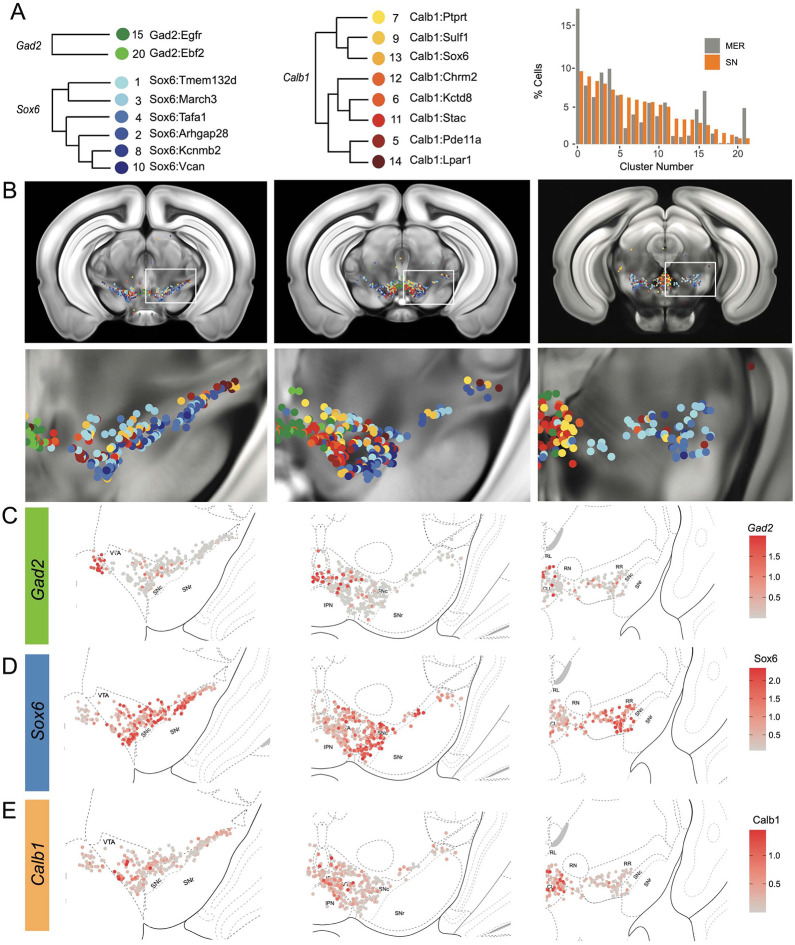
Figure 4.
Mapping of MERFISH data with snRNA-seq clustering: A) Grouping and recoloring of snRNA-seq clusters into distinct families represented by Gad2, Sox6 and Calb1 (Left). Relative proportion of dopamine neurons comprising each cluster from the snRNA-seq (SN, orange) and MERFISH label transfer (MER, grey) data (Right). B) Spatial representation of predicted clustering across the rostral-caudal axis, zoom of one representative hemisphere shown below. C-E) Imputed cellular expression of Gad2, Calb1 and Sox6 across the rostral-caudal axis.

