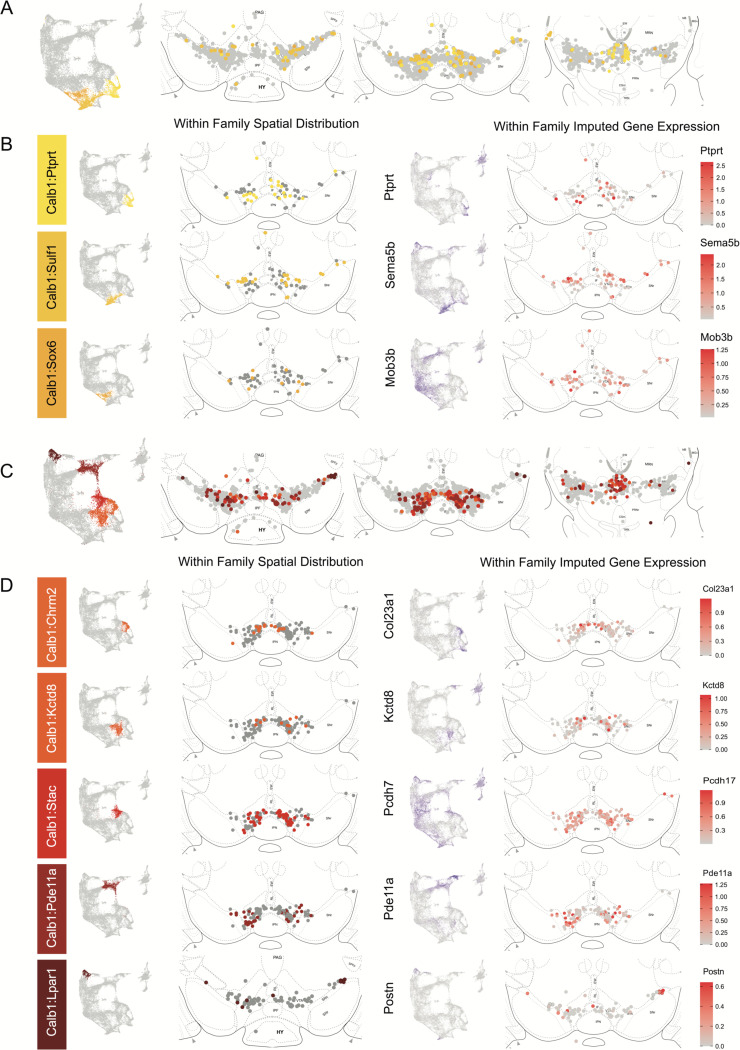
Figure 6.
Spatial localization of Calb1 family DA neurons. A) Calb1 family of neurons were divided into two distinct branches based on hierarchical clustering. Distribution of Branch 1 of Calb1 family DA neurons along the rostral-caudal axis with all other DA cells colored in grey. B) Location of individual Calb1-Branch1 clusters within the Calb1-Branch1 family. Only cells in the Calb1-Branch1 family are shown. Relative cellular expression of genetic markers associated with each subtype shown in a UMAP and brain section. C) and D) Same as A and B, but for Branch 2 of Calb1 family DA neurons. Relative cellular expression of genetic markers associated with each subfamily shown in a UMAP and a midbrain section.

