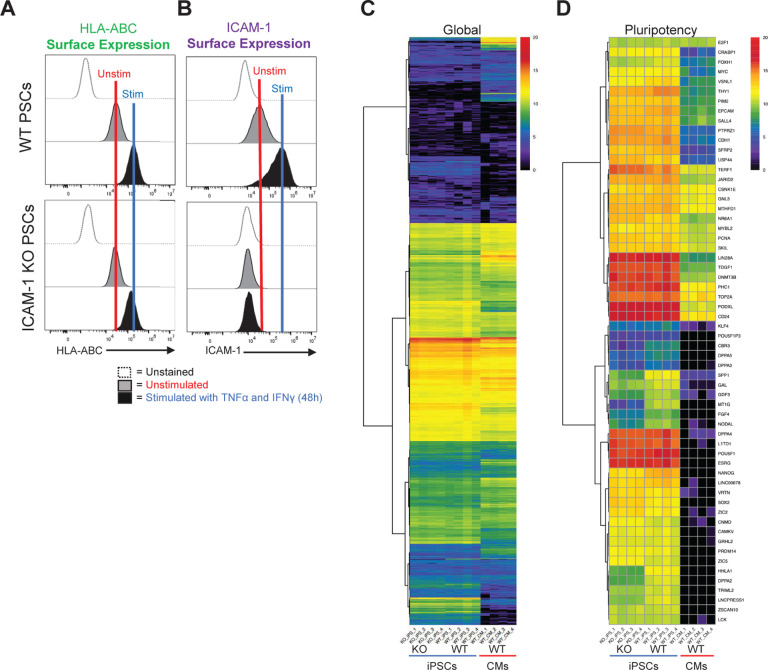
Figure 3. Transcriptomic and Protein Expression Analysis of ICAM-1 Knock-out (KO) vs Wild Type (WT) Cells.
ICAM-1 KO and WT isogenic pluripotent stem cells (PSCs) were stimulated with TNFα (10ng/ml) and IFNγ (50 ng/ml) for 48 hours, then assessed for (A) MHC class I expression and (B) surface ICAM-1 expression at baseline and following stimulation. (C) Bulk RNA sequencing was performed on ICAM-1 KO vs. WT induced PSCs (iPSCs); WT iPSC-derived cardiomyocytes (CMs) shown as a differentiated cell type reference control. Log2 RSEM counts for 21,055 transcripts from four cell culture wells (biological replicates, BRs) of PED05 ICAM-1 KO iPSCs, four BRs of PED05 WT iPSCs, and four BRs of PED05 WT iPSC-derived CMs. Clustering was performed and the graphic was made by running pheatmap in R Studio using Euclidean distance and ward.D hierarchical clustering metrics. (D) Log2 RSEM counts for 60 gene reference markers classifying PSC identity.

