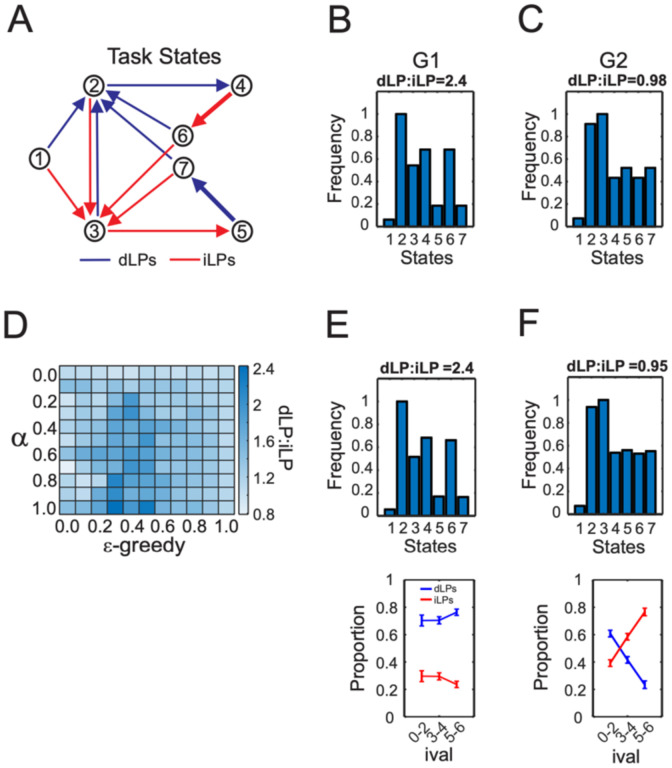
Figure 2: Quantifying choice behavior using a RL model.
A) The transition matrix showing all possible task states. Task states were defined according to all the possible lever-press to lever-press choice transitions for the task. The sessions always began from an initial state (state 1), which would be equivalent to the pre-task period. The rat (or agent) could then choose to perform either a dLP (blue) or iLP (red) until they made repeated presses on either lever, which would then initiate a forced choice trial (thick lines with open arrows, states 5→7 or 4→6). Task state distributions of G1 (B), G2 (C). D) Parameter space of the effects of changing the learning rate (α) and the likelihood of exploration (ε-greedy) on dLP:iLP. The heat plot gives the free choice dLP:iLP produced by different model parameters. γ was held at 0.2 for all simulations. E) Simulations that matched the dLP:iLP of G1 (Left), G2 (Right) sessions were obtained using the same RL parameters (α=0.95; ε-greedy=0.4; γ=0.2) but a dbias term of 0.4 was included for the simulations shown in the right panel. In B and D, the task state frequency distributions were averaged across sessions and normalized to the maximum state visitation frequency.

