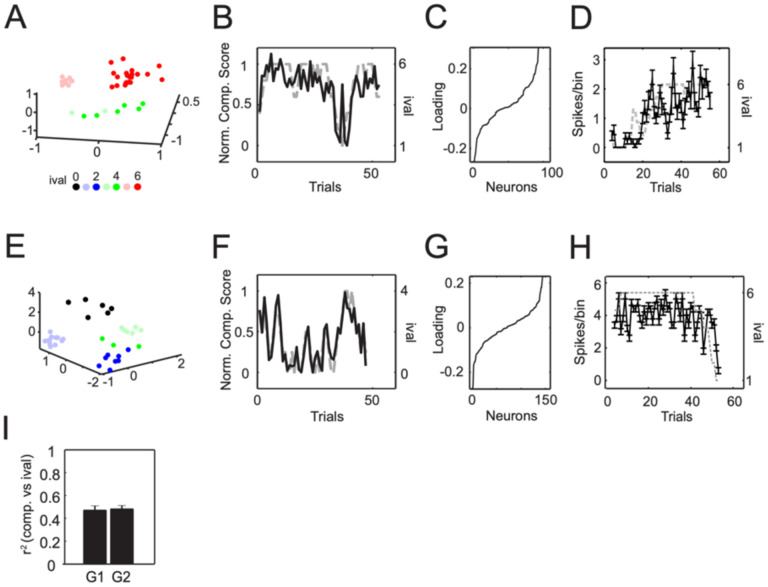
Figure 4: Robust ival tracking was present in all 3 groups.
A) MCML was performed on concatenated spike count matrices of the LP epoch for an example session from G1. The clusters were colored according ival on the trial in which the LP was performed. B) The MCML components tracking ival across trials from another G1 session. C) The sorted loadings of neurons on the components shown in (B). D) Examples of neurons exhibiting ival tracking. The mean (and s.e.m.) spike rate/0.2s bin in the 1s period preceding the LP on each trial is plotted in black and ival is given by the gray dotted line. (E-H) same as (A-D) but for G2. I) The mean (and s.e.m.) r2 between ival and the ival-tracking component associated with the LP epoch for all sessions in G1 and G2.

