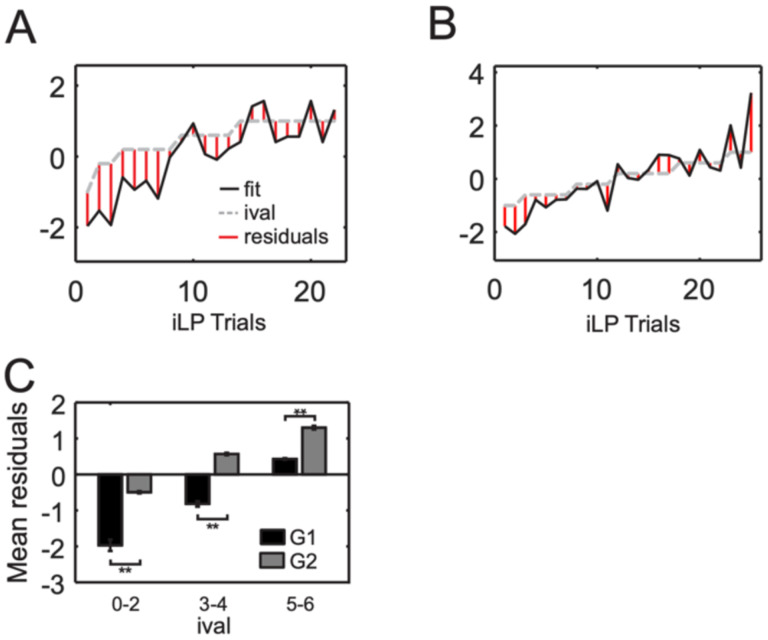
Figure 5: Group differences in tracking of ival by single neurons.
For each neuron, a linear regression model was used to fit the z-scored mean spike count during the LP epoch across trials with ival. A) Example of a neuron from G1. B) Example of a neuron from G1. In (A) and (B), model fit line is black, the normalized ival line is dotted gray, the residuals on iLP trials are given by the red vertical lines. The sign of the residuals relates to whether the fit line was below ival (negative residual) or above ival (positive residual). C) Summary of the mean of the residuals on all iLP trials for G1 (black bars) and G2 (gray bars). Neurons had to have a mean spike count of at least 0.2 spikes/bin during the LP epoch of all trials and an r2 of 0.2 or greater to be included in (C). ** denotes p<0.001 based on post-hoc multiple comparison testing (Tukey’s HSD).

