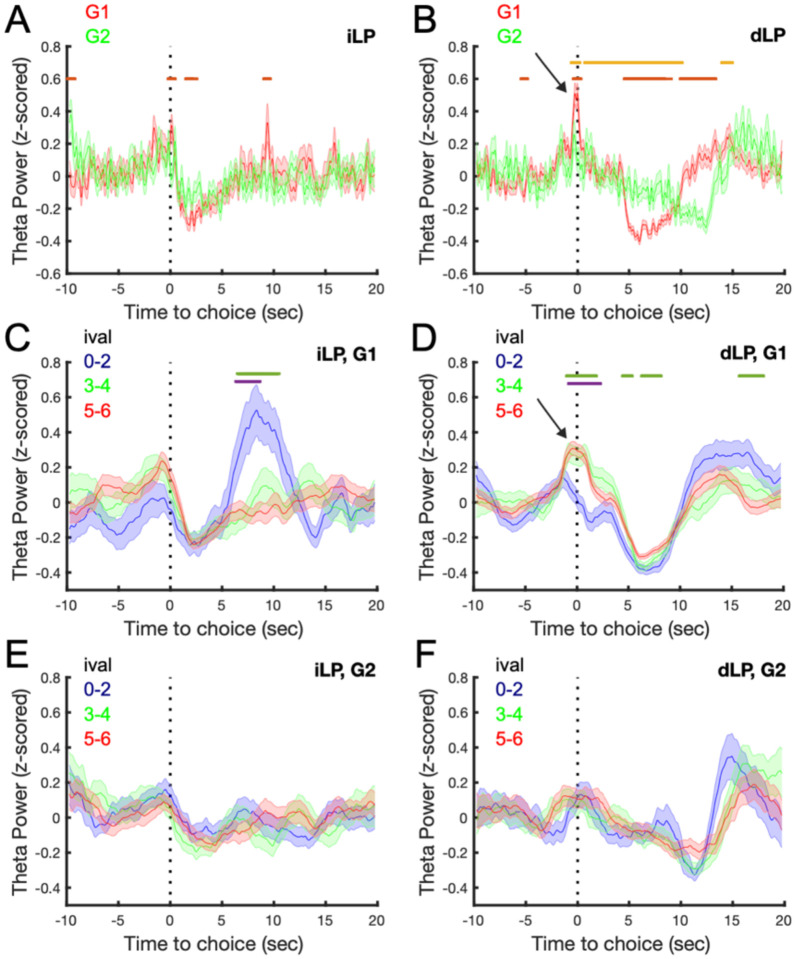
Figure 6: Theta power increases prior to delay choices when it is the preferred option.
Theta oscillations were examined prior to iLPs (A) and dLPs (B). Theta power was highest in G1 prior to a dLP when compared with G2 or an iLP in G1. Stratifying theta power by ival revealed increases ~10 sec following an iLP in G1 for low ivals (C). Increases in theta power around a dLP were observed for mid and high ivals (D). While no effect of ival was observed for iLPs (E) or dLPs (F) in G2. Data are presented at mean ± SEM. Red line denotes Tukey’s HSD, p < 0.05 G1 vs G2; Orange line denotes Tukey’s HSD, p < 0.05 G1 dLPvs G2 dLP (A, B). Green line denotes Tukey’s HSD, p < 0.05, 0–2 vs 5–6 ival; purple line denotes Tukey’s HSD, p < 0.05, ival 0–2 vs 3–4.

