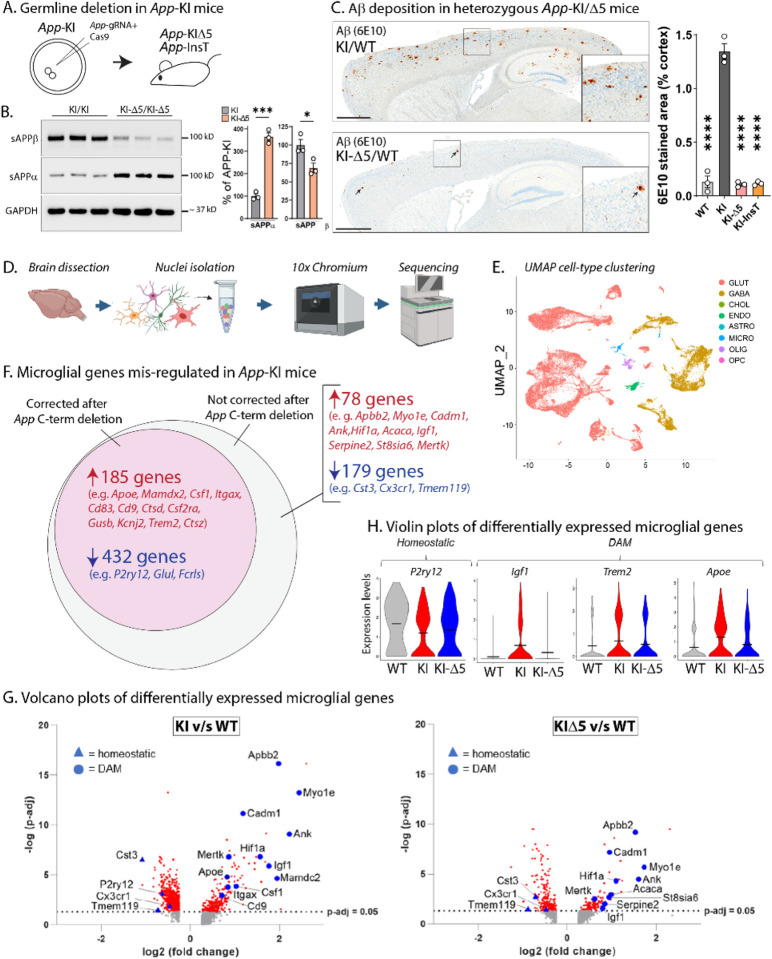
Figure 3: Germline App C-terminus editing in App-KI and WT mice.
A) Strategy for generating App-KIΔ5/InsT mice by germline CRISPR-deletion. Zygotes from App-KI mice were injected with App-gRNA/Cas9 ribonucleoprotein complexes targeting the App C-terminus, and resulting founders were screened and outbred to produce stable heterozygous and homozygous lines (also see Supp. Figs. 5–6).
B) Reversal of APP β/α cleavage pattern in germline-edited App-KI mice, quantified on right.
C) Representative sections of Aβ staining in germline-edited heterozygous App-KI mice. Note that Aβ plaques are almost absent in the edited mice (bottom panel, small arrowheads point to rare plaques, also see Supp. Fig. 6E), quantified on right. Scale bar = 1mm, data shown as mean +/− SEM. N = 3/condition. * p < 0.05, ***p < 0.001, **** p < 0.0001 and ns = non-significant.
D) Workflow for sNuc-Seq from App-KI and App-KIΔ5 mouse brains (N = 2 brains per genotype). Transcriptomic profiles of isolated nuclei were generated with 10x chromium sNucSeq, followed by deep sequencing of cDNA libraries.
E) UMAP (Uniform Manifold Approximation and Projection) visualization (right) shows efficient sorting into different cell-types (also see Supp. Fig. 6A).
F) Venn-diagrams showing mis-regulated microglial genes in App-KI mice (p-adj > 0.05) that were either corrected after gene-editing (pink), or not (grey). Genes in red were upregulated, and genes in blue were downregulated; some examples of DAM/homeostatic genes are listed (see Supp. Tables 3–5 for full lists). Note that mis-expression of ~ 71% of microglial genes was corrected after App C-terminus editing.
G) Volcano plots of differentially expressed microglial genes in App-KI and App-KIΔ5 mouse brains (compared to WT brains) showing the – log10 (adjusted p-value) and the log2 fold change (FC) in expression for all genes with log2FC > 0.25. Note that several homeostatic (blue triangles) or DAM (blue circles) microglial genes are up-regulated or down-regulated in App-KI brains, compared to WT brains (left graph). Similar analyses on App-KIΔ5 mouse brains shows that mis-regulation of many of these microglial genes is substantially attenuated in the App-KIΔ5 setting, suggesting restoration of homeostasis upon gene-editing.
H) Violin plots showing the distribution of expression levels for key DAM and homeostatic genes. Wider sections of the violin plot represent higher probability of expression at a given level, thinner sections indicate a lower probability, and short horizontal lines indicate mean values. Note mis-regulation in App-KI, and shift towards WT in App-KIΔ5 mouse brains.

