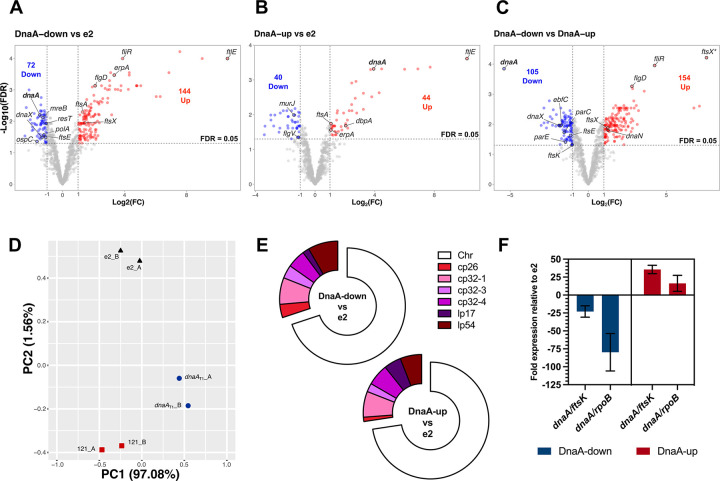
Figure 7. RNA-seq of DnaA-dysregulated B. burgdorferi.
The RNA from three B. burgdorferi strains with different cellular levels of DnaA were sequenced: B31-e2 (parent), CRISPRi dnaAT1 (DnaA-down), and overexpression pACK121 (DnaA-up). (A-C) Volcano plots plotting the fold change (log2FC) against each gene’s false discovery rate (−log10(FDR)). The threshold for significance was set at a log2FC ≥ 1 or ≤ − 1 (≥ 2-fold change) and an FDR of ≤ 0.05. (D) PCA plot showing the clustering of the replicate samples that were sequenced. (E) Donut charts showing the replicons on which the significantly affected genes are encoded. (F) qRT-PCR results of dnaA transcripts in the sequenced samples. Cq values were normalized to ftsK or rpoB (ΔCq) and then to the parental strain (ΔΔCq). Error bars represent the standard deviation (SD).

