
Fig. 3.
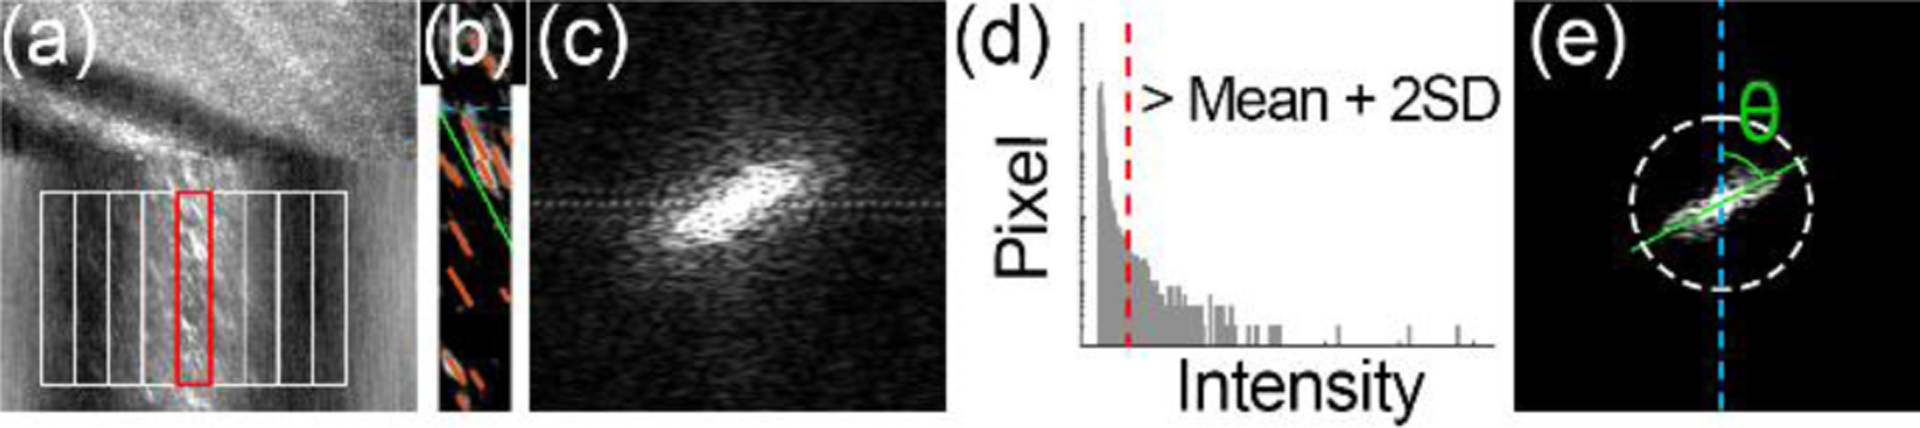
Automatic motion traces angle measurement. (a) The cross-section of the vessel is divided into a series of segments to calculate the velocity across the lumen. (b) Red blood cell motion traces in a single segment. (c) Fast Fourier Transform (FFT) of panel (b). (d) The spectral intensity of panel (c). The dashed red line indicates low-intensity noise to be removed. (e) The FFT image after noise reduction. The angle indicated by the green line represents the mean velocity of red blood cells in this segment. White ring delimits the reserved spectral components after removing the low-intensity noise, indicating the minimum resolvable spatial grating spacing is ~2.8 μm.