
FIGURE 1.
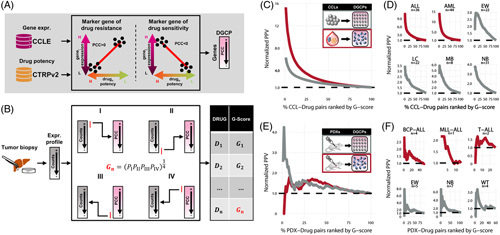
Overview of DrugSense and in silico validation in CCLs and PDX models in the Childhood Cancer Therapeutics portal. (A) Training phase: expression biomarkers of resistance and sensitivity are identified for each drug present in the CTRPv2 database. Biomarkers are selected by correlating gene expression with drug potency across cell lines. The drug potency is as the AUC of the dose-growth inhibition curve. Each dot refers to one cell line and indicates the cell line-specific expression of the gene (y-axis) and the cell line-specific drug potency (x-axis). The PCC between gene expression and drug potency is thus computed for each gene. Genes are ordered by PCC to obtain the DGCP. (B) Analysis of a tumor transcriptional profile: the gene expression profile is sorted from the most to the least expressed gene and compared against the DGCP of a drug by Gene Set Enrichment Analysis. The drug G-score is defined as the geometric mean of four p-values computed by performing 4 Gene Set Enrichment analyses to check whether: (1) the 250 most expressed genes in the tumor tend to be biomarkers of sensitivity; (2) the 250 least expressed genes in the tumor tend to be biomarkers of resistance; (3) the 250 biomarkers of sensitivity at the bottom of the DGCP tend to be upregulated in the tumor; (4) the 250 biomarkers of resistance at the top of the DGCP tend to be downregulated in the tumor. Drugs are then ranked by their G-score in ascending order according to their predicted potency. (C, D) CCL/drug pairs are ranked according to their G-score in ascending order and reported as percentiles on the x-axis. The PPV is normalized against the random PPV (black dashed line) obtained by ordering drug randomly rather than according to their G-score. Normalized PPVs for 672 CCLs from solid (gray) and 83 from liquid (red) tumors in (C), whereas PPV curves for 6 distinct collections of cell lines from pediatric tumors are shown in (D). (E, F) PDX/drug pairs are ranked according to their G-score in ascending order and reported as percentiles on the x-axis. Normalized PPV of DrugSense for all PDXs derived from solid tumors (gray) and liquid tumors (red) are shown in (E). PPV curves for PDX belonging to the 6 distinct pediatric tumors are shown in (F). Abbreviations: ALL, acute lymphocytic leukemia; AML, acute myeloid leukemia; BCP-ALL, B-cell precursor acute lymphoblastic leukemia; CCL, cancer cell line; CCLE, Cancer Cell Line Encyclopaedia; CTRPv2, Cancer Therapeutics Response Portal; DGCP, drug-gene correlation profile; EW, Ewing sarcoma; LC, liver cancer; MB, medulloblastoma; NB, neuroblastoma; MLL-ALL, MLL-rearranged acute lymphoblastic leukemia; PCC, Pearson correlation coefficient; PDX, patient-derived xenograft; T-ALL, T-cell acute lymphoblastic leukemia; WT, Wilms tumor.