
FIGURE 2.
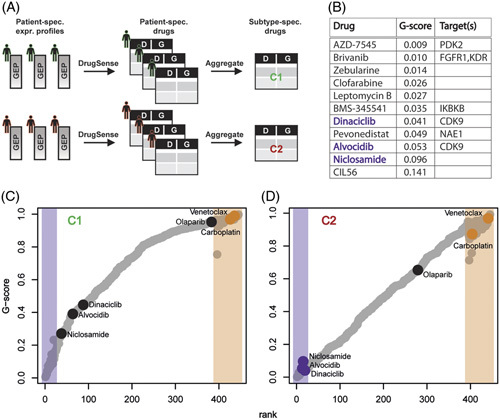
DrugSense identifies drugs specific for the aggressive C2 hepatoblastoma subtype. (A) Transcriptional profiles in a cohort of 24 patients with hepatoblastomawhose tumor belonging either to the C1 subtype (n=18) or the C2 subtype (n=8). Each profile was separately analyzed by DrugSense yielding a ranked list of drugs for each patient. The patient-specific ranked lists of drugs for patients of the same subtype (C1 or C2) were aggregated together to yield a single list of drugs. At the end of the process, only 2 subtype-specific ranked lists of drugs remain, one for the C1 subtype and one for the C2 subtype. (B) The 11 drugs predicted to be specific for the C2 subtype ordered by median G-score. (C, D) Median G-score across patients with C1 (C) and patients with C2 (D) for each of the 445 drugs. Highlighted regions show the top 20 ranked drugs (purple) and bottom 50 ranked drugs (orange) determined using the Cross-Entropy Monte Carlo algorithm to aggregate the drug-ranked lists of individual patients (Methods). Abbreviations: D, drug; G, G-score; GEP, gene expression profile.