
FIGURE 3.
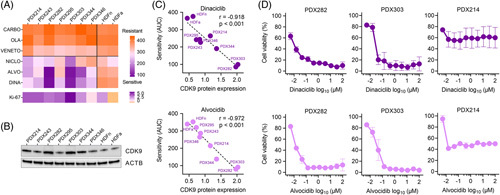
In vitro validation of DrugSense in hepatoblastoma cell culture models. (A) A heatmap showing drug sensitivity of the 7 liver cancer models and normal neonatal (HDFn) and adult (HDFa) skin fibroblasts to CARBO, OLA, VENETO, NICLO, ALVO, and DINA. AUC values are the mean out of 2 independent cell viability experiments, each consisting of duplicate measurements. The color scale from orange to purple indicates increasing sensitivity to drug treatment. Ki-67 depicts relative RNA expression of the MKI67 gene normalized to the housekeeping gene TATA-box binding protein. (B) Western blot detection of CDK9 and ACTB in 7 cultures from PDX cell lines established from patients with hepatoblastoma. (C) Correlation of sensitivity (AUC) toward dinaciclib and alvocidib with relative CDK9 protein expression (normalized to ACTB expression) in 7 liver cancer models (PDX) and normal neonatal (HDFn) and adult (HDFa) fibroblasts. Pearson r and 2-tailed p-values were calculated, and linear regression is given as dashed lines. (D) Dose-response curves of alvocidib and dinaciclib treated cells of the 2 most sensitive tumor models PDX282 and PDX303, as well as the PDX214 model. Error bars stand for standard error of the mean of 2 independent experiments, each consisting of duplicate measurements. Abbreviations: ACTB, beta-actin; ALVO, alvocidib; CARBO, carboplatin; CDK9, cyclin-dependent kinase 9; DINA, dinaciclib; HDF, Human Dermal Fibroblasts; NICLO, niclosamide; OLA, olaparib; PDX, patient-derived xenograft; VENETO, venetoclax.