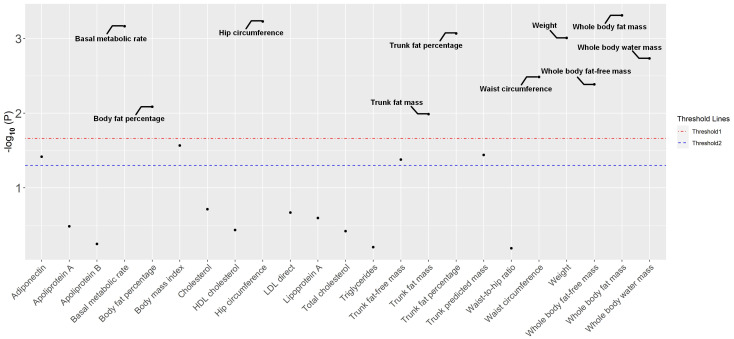
Figure 1.
The distribution of P-values for the associations between 23 metabolic factors related to anthropometric indicators and ovarian cancer in the MR analysis. Two thresholds were used to assess significance. One represented the threshold adjusted for false discovery rate (threshold line 1), while the other relied on a commonly used P-value (0.05). MR, Mendelian randomization.

