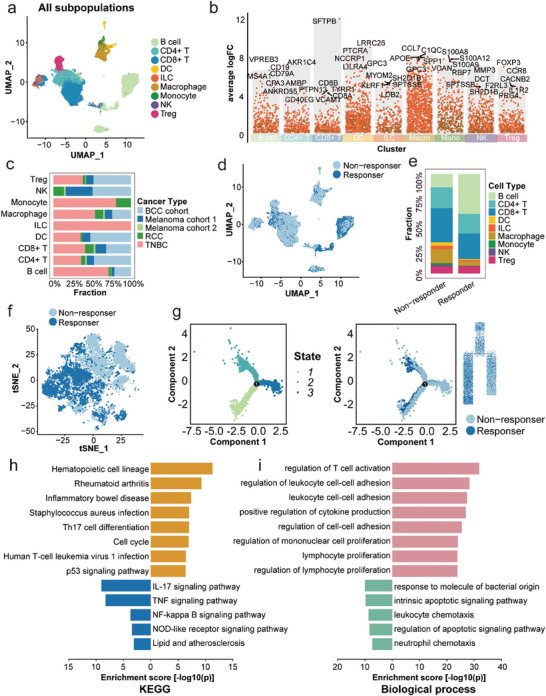
Figure 1.

Immune cell landscape of ICI‐treated pan‐cancers. a) Color‐coded UMAP plot of cell types in five cohorts with ICI treatment. b) Feature genes of each cell type. c) The proportion of cohorts in each cell type. d) The distribution of ICI responders and non‐responders in all cells. e) The proportion of each cell type between responders and non‐responders. f) The distribution of ICI responders and non‐responders in macrophages. g) Trajectory analysis of ICI responders and non‐responders. h) KEGG analysis of DEGs between ICI responders and non‐responders. i) Biological Process of GO enrichment of DEGs between immunotherapy responders and non‐responders. ICI: immune checkpoint inhibitor; UMAP: uniform manifold approximation and projection; KEGG: Kyoto Encyclopedia of Genes and Genomes; DEGs: differential expressed genes; GO: Gene Ontology.
