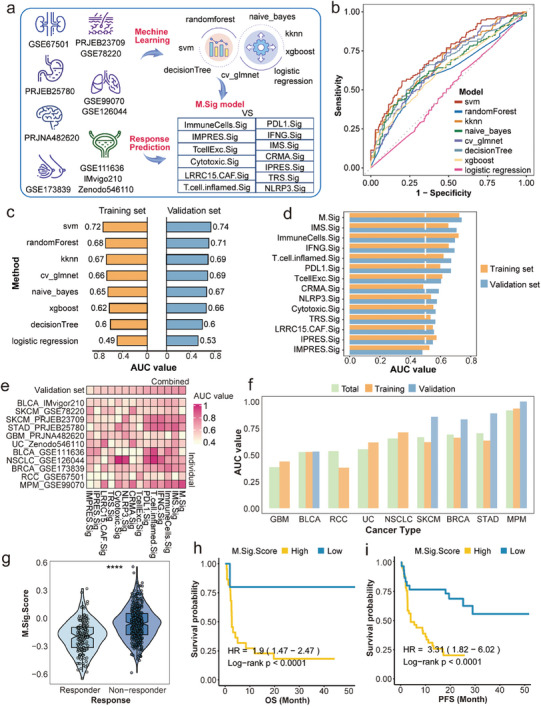
Figure 2.

Construction of the M.Sig model to predict ICI response and prognosis. a) Workflow of the construction and validation of the M.sig model. b) The AUC of eight machine learning algorithms in the training set. c) Eight AUC values of the training set and the test set of eight machine learning algorithms. d) Comparison of the AUCs among the M.Sig model and other thirteen immune signatures in the training set and the test set. e) Comparison of the AUCs in each cohort. f) The AUCs of the M.Sig model in each cancer type. g) Different M.Sig.Score between ICI responders and non‐responders in the training set. h,i) OS and PFS of high or low M.Sig.Score in the training set. ICI: immune checkpoint inhibitor; AUC: area under the curve; OS: overall survival; PFS: progression‐free survival.
