
Figure 3.
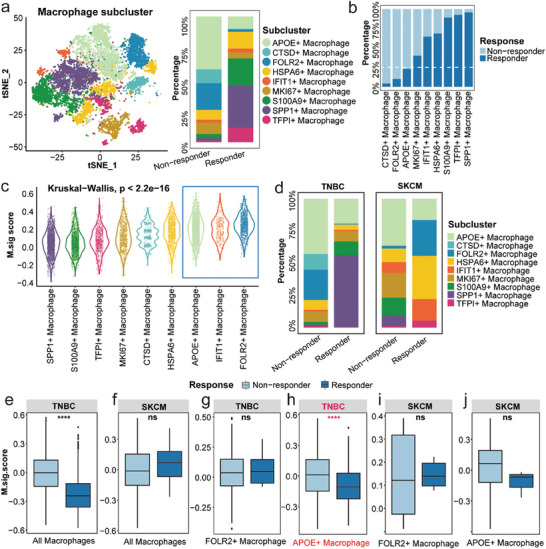
Different M.Sig.Score in macrophage subpopulations between responders and non‐responders. a) Colour‐coded tSNE plot of eleven macrophage subgroups and the proportion of subgroups in ICI responders and non‐responders. b) The proportions of each macrophage subgroup in ICI responders and non‐responders. c) M.Sig.Score of each macrophage subset. d) The proportion of each macrophage subgroup in ICI responders and non‐responders of TNBC and SKCM. e–j) The M.Sig.Score of macrophage subsets between ICI responders and non‐responders of TNBC and SKCM. tSNE: t‐distributed stochastic neighbor embedding; ICI: immune checkpoint inhibitor; TNBC: triple negative breast cancer; SKCM: skin cutaneous melanoma.