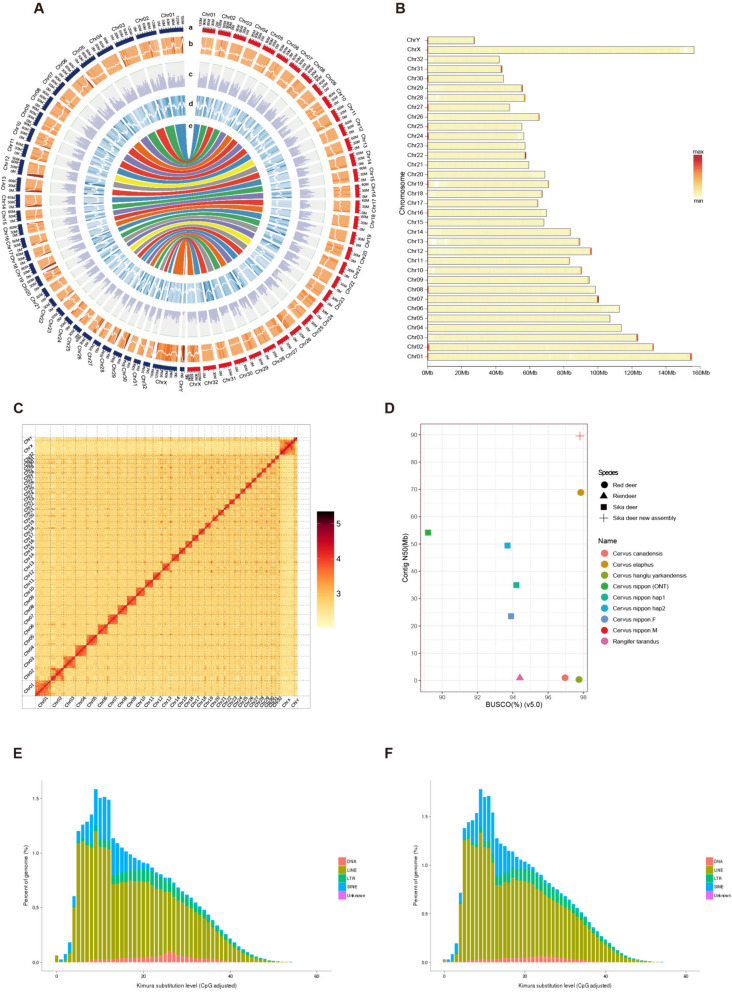
Fig. 1.
Overview of Cervus nippon genome assembly and repeat sequence annotation. A Genomic landscape of the sika deer. From outer to inner circles: a, the chromosomes at the Mb scale (red color is Cni-F 2.0 chromosomes, blue color is Cni-M chromosomes); b-d, repeat density, gene density, and GC density across the genome, respectively, drawn in 5 Mb non-overlapping windows; e, collinearity of the chromosome-level genome of Cni-M and Cni-F 2.0. B Heatmap of chromosomal telomeric motif density distribution. C Hi-C interaction heatmap of the Cni-M. The darker the colour, the stronger the interaction signal, the closer the interaction regions. D Comparison of the newly assembled sika deer genome with 8 published deer genomes based on BUSCO and Contig N50. E, F Classification and substitution level of TEs in the Cni-M and Cni-F 2.0. The x-axis represents the kimura substitution level (CpG adjusted) of TEs. The y-axis represents the percentages of TEs in the genome. The different colours represent different types of transposons

