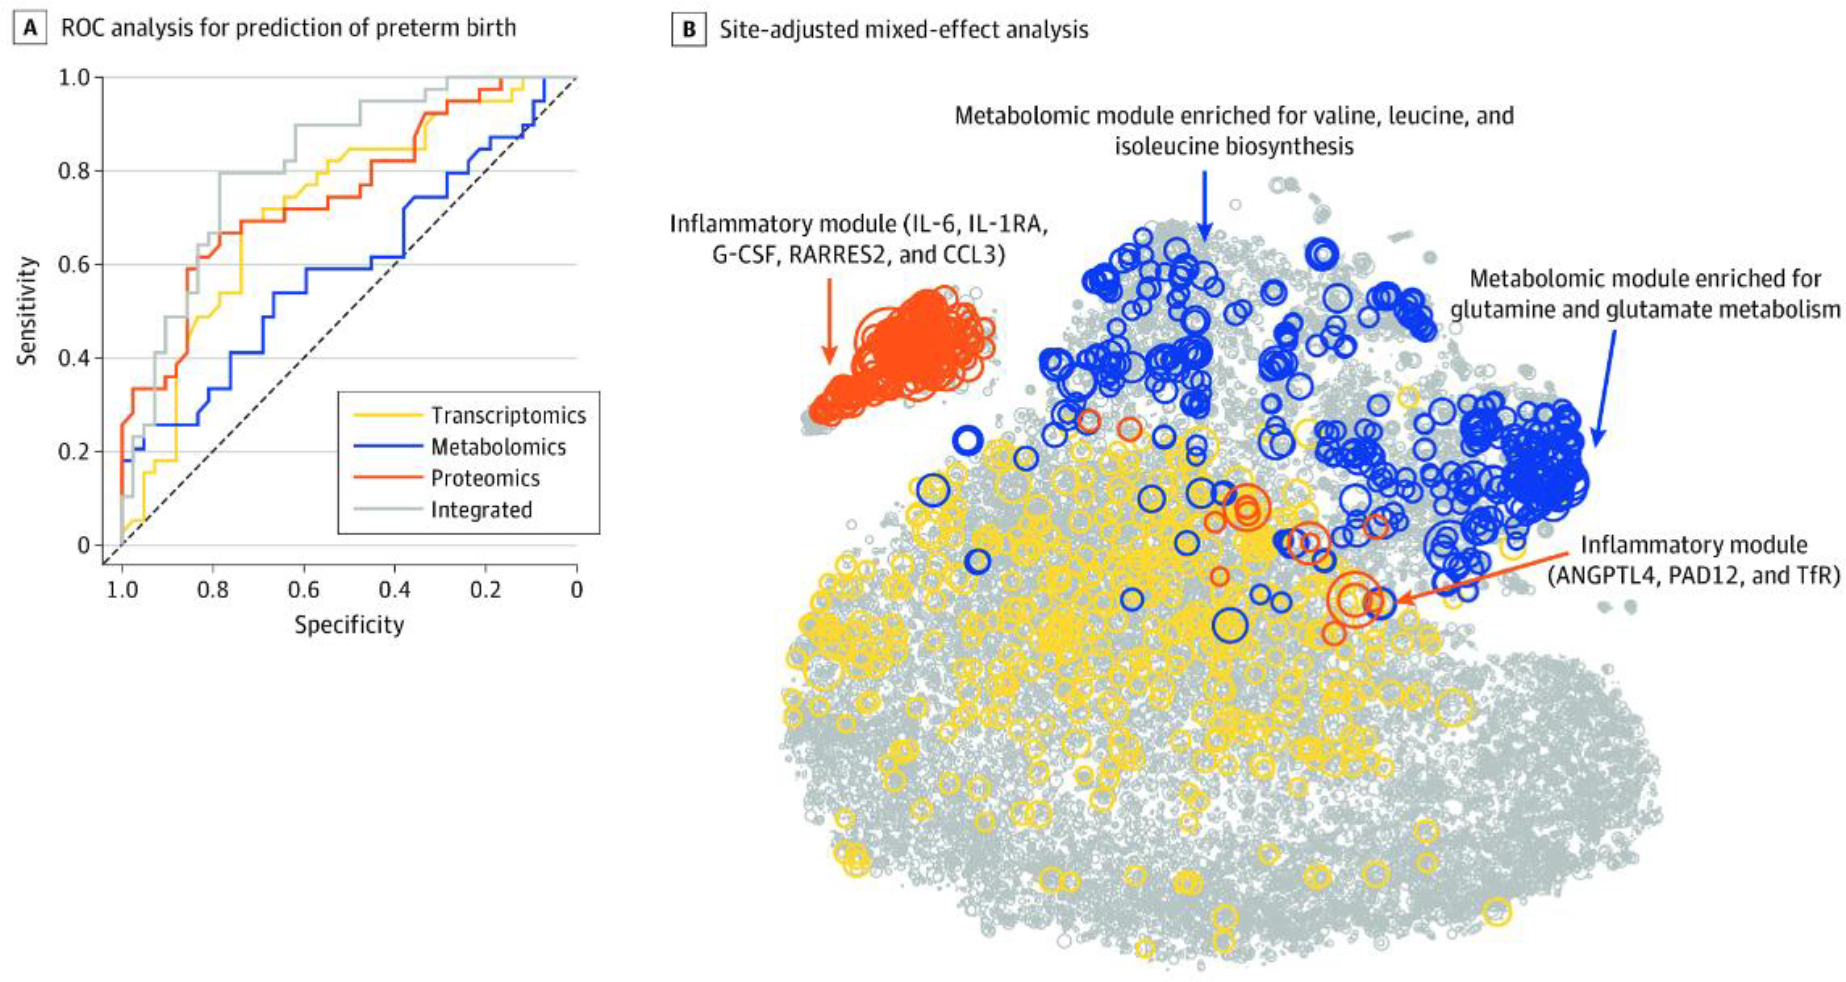
Fig. 1. Predictive Modeling of Preterm Birth.

A. This receiver operating characteristic (ROC) curve analysis used each biological modality and the integrated approach. The mean area under the ROC curve and 95% confidence interval (CI) for each modality were as follows: transcriptomics (area under the ROC [AUROC]; 0.73; 95% CI: 0.61, 0.83), metabolomics (AUROC: 0.59; 95% CI: 0.47, 0.72), proteomics (AUROC: 0.75; 95% CI: 0.64, 0.85), and integrated (AUROC: 0.83; 95% CI: 0.72, 0.91). B. Circle size is proportional to −log10 (Wilcoxon) p-value for discrimination between term pregnancies and preterm births. Top features included an inflammatory module (which included interleukin 6 [IL-6]; IL-1 receptor antagonist [IL-1RA], a regulatory member of the IL-1 family whose expression is induced IL-1β under inflammatory conditions; granulocyte colony-stimulating factor [G-CSF]; retinoic acid receptor responder protein 2 [RARRES2]; chemokine ligand 3 [CCL3]; angiopoietin-like 4 [ANGPTL4]; protein-arginine deiminase type II [PADI2]; and transferrin receptor [TfR]) and a metabolomic module (which was enriched for glutamine and glutamate metabolism [Fisher test for pathway enrichment analysis p<4.4×10⁻⁹] and valine, leucine, and isoleucine biosynthesis pathways [p<7.3×10⁻⁶]). From Jehan F, Sazawal S, Baqui AH, et al. Multiomics characterization of preterm birth in low- and middle-income countries. JAMA Netw Open 2020;3(12):e2029655.
