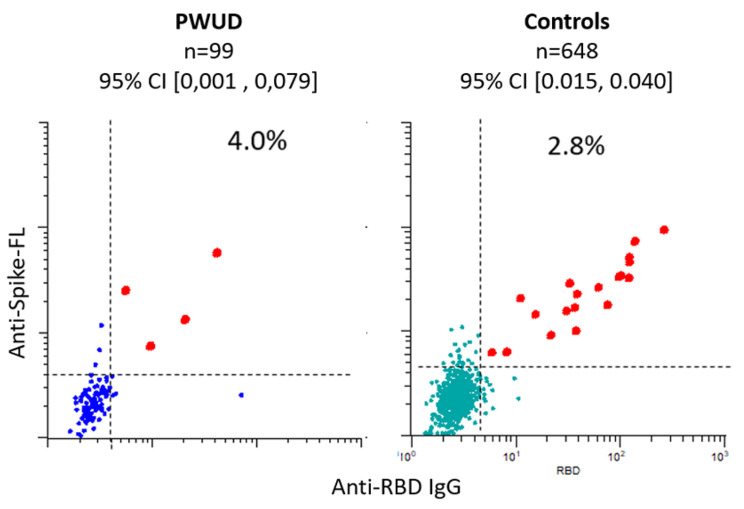
Fig. 3.
Sensitivity analyses of SARS-CoV-2 seroprevalence. Note. The dot plots show levels of antibodies (log 10) to indicated SARS-CoV-2 proteins in sera from indicated cohorts. Each dot represents a different sample. Spike-FL: full-length spike protein from SARS-CoV-2. RBD : receptor-binding domain. Bead-based arrays with virus proteins were incubated with serum diluted 1:100, labelled with R-Phycoerythrin (R-PE)-conjugated anti-human IgG Fc and analyzed by flow cytometry. The values correspond to R-PE median fluorescence intensity (MFI) measured for beads with indicated virus protein divided by the MFI measured for beads with neutravidin only. The dashed lines correspond to cutoffs set by analyzing prepandemic samples (Fig. 2a)

