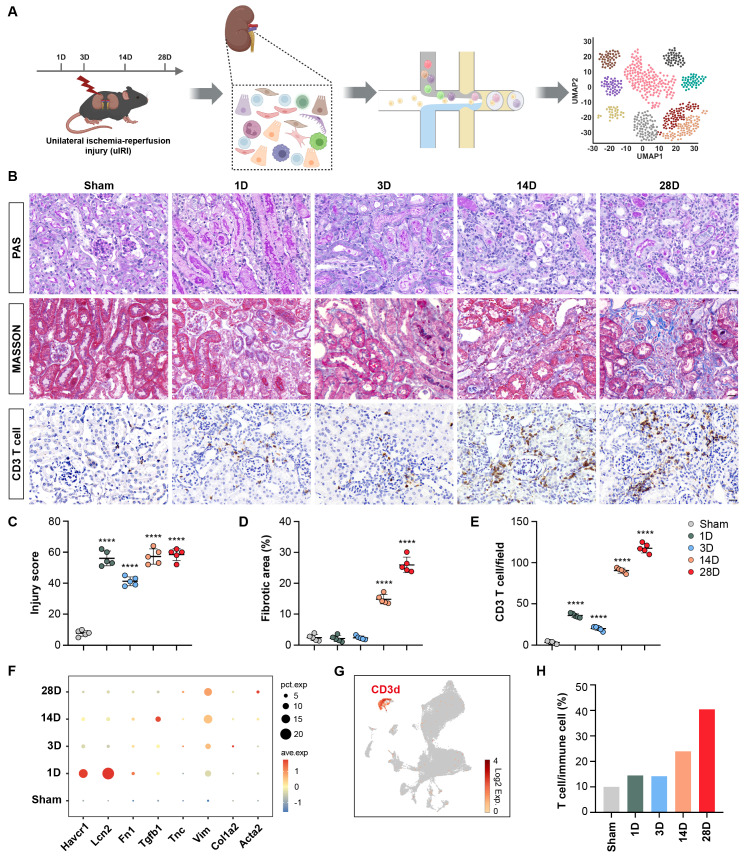
Figure 1.
Single-cell RNA-sequencing atlas of T cells during AKI to CKD transition. (A) Flow chart illustrated the progress of the experimental project for scRNA-seq analysis. (B) Representative histopathology images of PAS and Masson's staining at each time point in the uIRI model after AKI. Representative images of CD3 immunohistochemical staining at each time point in the uIRI model after AKI. (C-E) Quantification of injury score, fibrotic area, and CD3+ T cells based on five mice. (F) Expression levels of Hepatitis A virus cellular receptor 1(Havcr1), Lipocalin 2 (Lcn2), Fibronectin 1 (Fn1), Transforming growth factor beta 1 (Tgfb1), Tenascin C (Tnc), Vimentin (Vim), Collagen type I alpha 2 (Col1a2), and Actin alpha 2 (Acta2) in the kidney after AKI. (G) UMAP plot colored by CD3d, representing T-cell annotation. (H) Proportions of T cells among immune cells after AKI. Scale bars, 20μm. Data are presented as means ± SD. **** P < 0.0001 compared to the sham group.

