Figure 5.
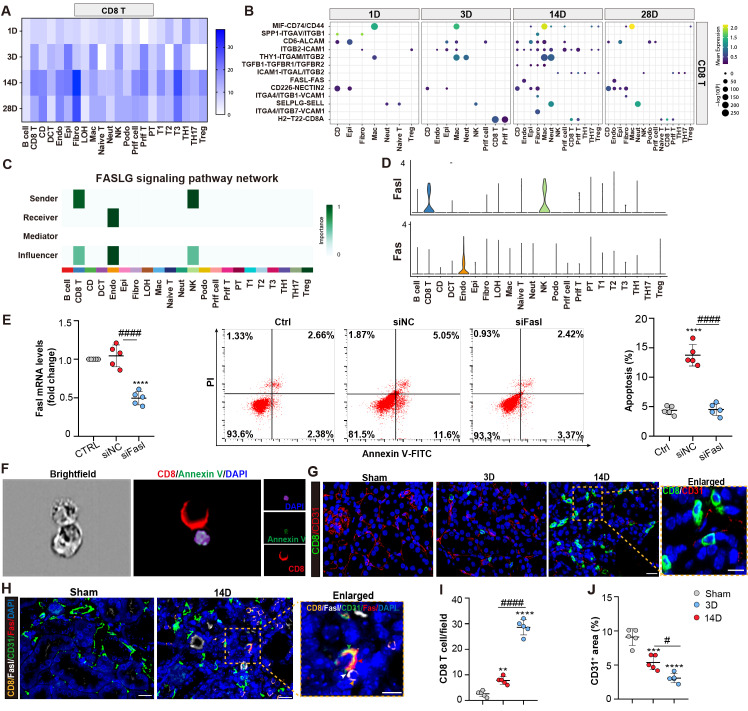
CD8 T cells induce endothelial cell apoptosis through Fasl-Fas signaling. (A) The interaction numbers between the CD8 T cells and other cells at each time point. (B) The pathway network between the CD8 T cells and other cells. (C-D) Enriched FASLG signaling pathway networks and significant ligand-receptor pair Fasl-Fas in CD8 T and endothelial cluster. (E) Flow cytometry results of the apoptosis of endothelial cells, when co-cultured with CD8 T cells, transfected with Fasl siRNA or NC siRNA. (F) Representative images showing CD8 positive T cells attach to Annexin V and DAPI positive endothelial cells using ImageStream®X Mk II. (G) Representative immunofluorescence images of the number and location of CD8 T cells and CD31+ area in 3D and 14D uIRI model. (H) Representative immunofluorescence images of the spatial distribution of Fasl positive CD8 T cells, alongside Fas, CD31 positive endothelial cells. (I, J) Quantifying the number of CD8 T cells and CD31+ area in 3D and 14D uIRI model (n=5). Scale bars, 20μm (Enlarged Scale bars, 10μm.). Data are presented as means ± SD. **P<0.01, ***P<0.001, ****P<0.0001, compared to control or sham group; # P<0.05, #### P<0.0001, compared to CD8 transfected with NC siRNA group or 3D uIRI model.

